And sorry to add another post, but in reality you must use both. As using a debugger is often the easiest way to debug  during development but not always possible and as soon as the program is “out there” you’re getting log files/traces at best.
Debugger for C
0 Likes
KarloSiric
#22
I thank you for all the helpful information you have provided me here I will sure give it another try at setting this up and see how it goes, I really do need a debugger because of later projects I might try doing in C and it will be really useful to have it around. 
0 Likes
KarloSiric
#23
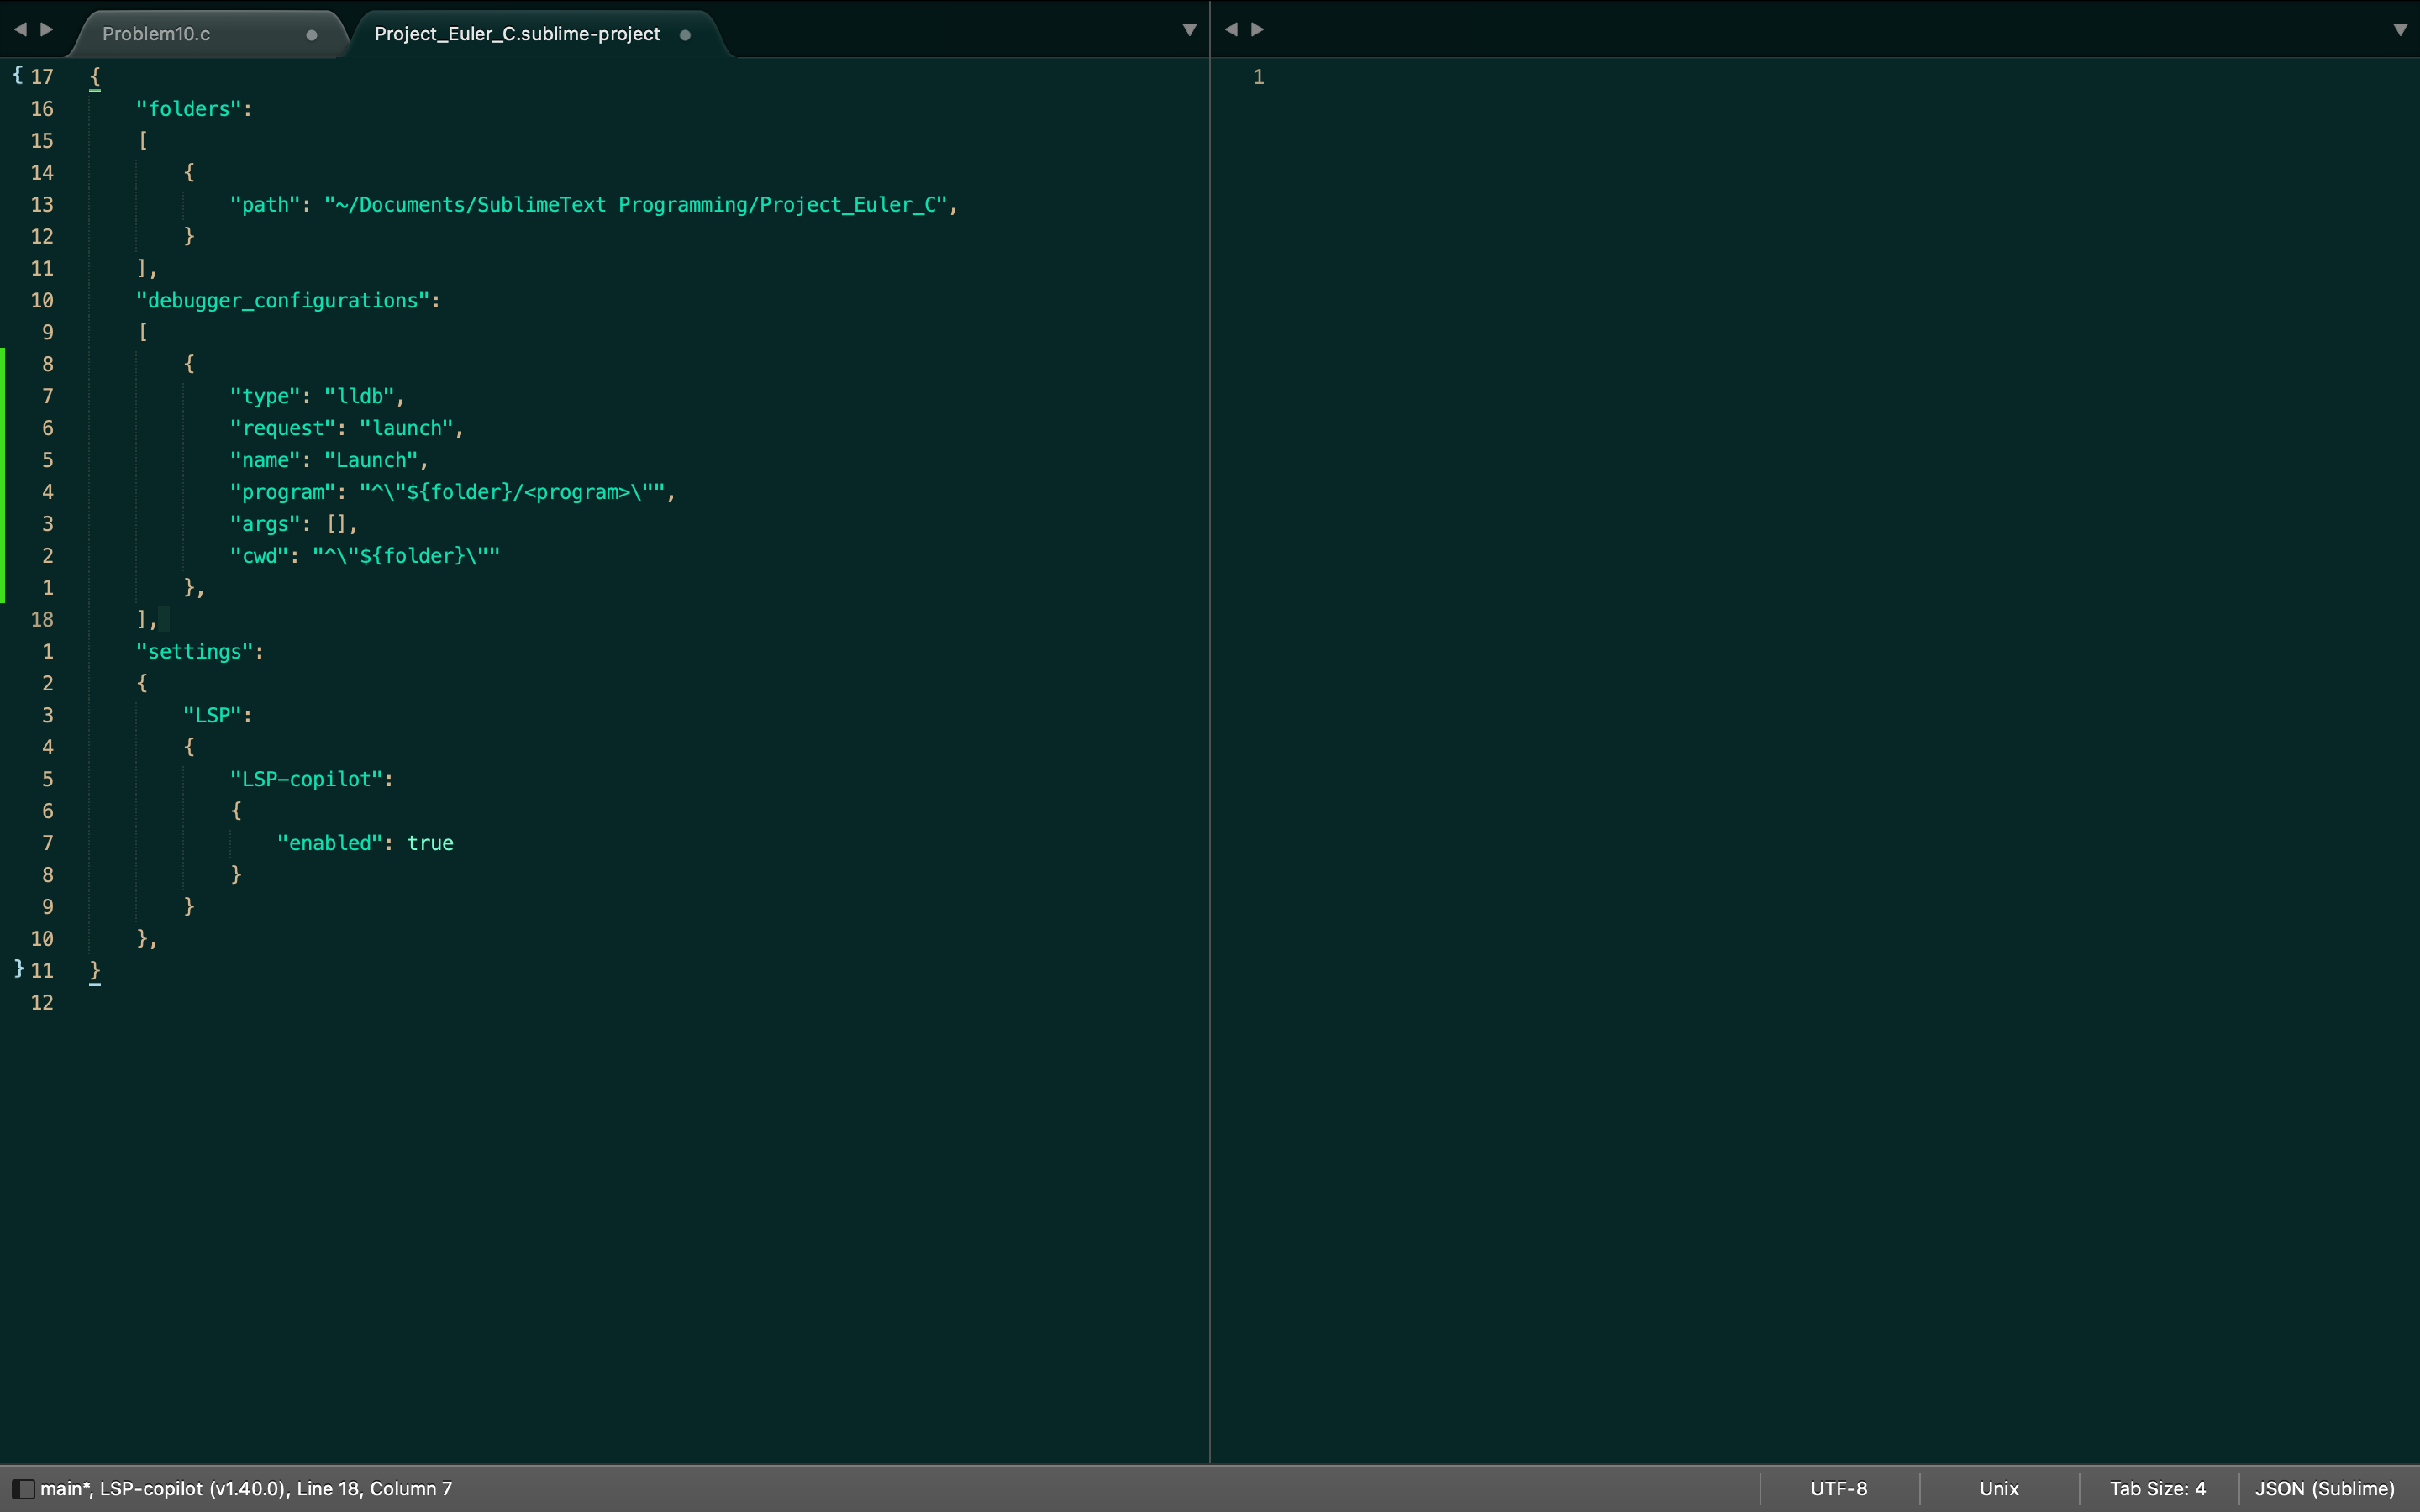
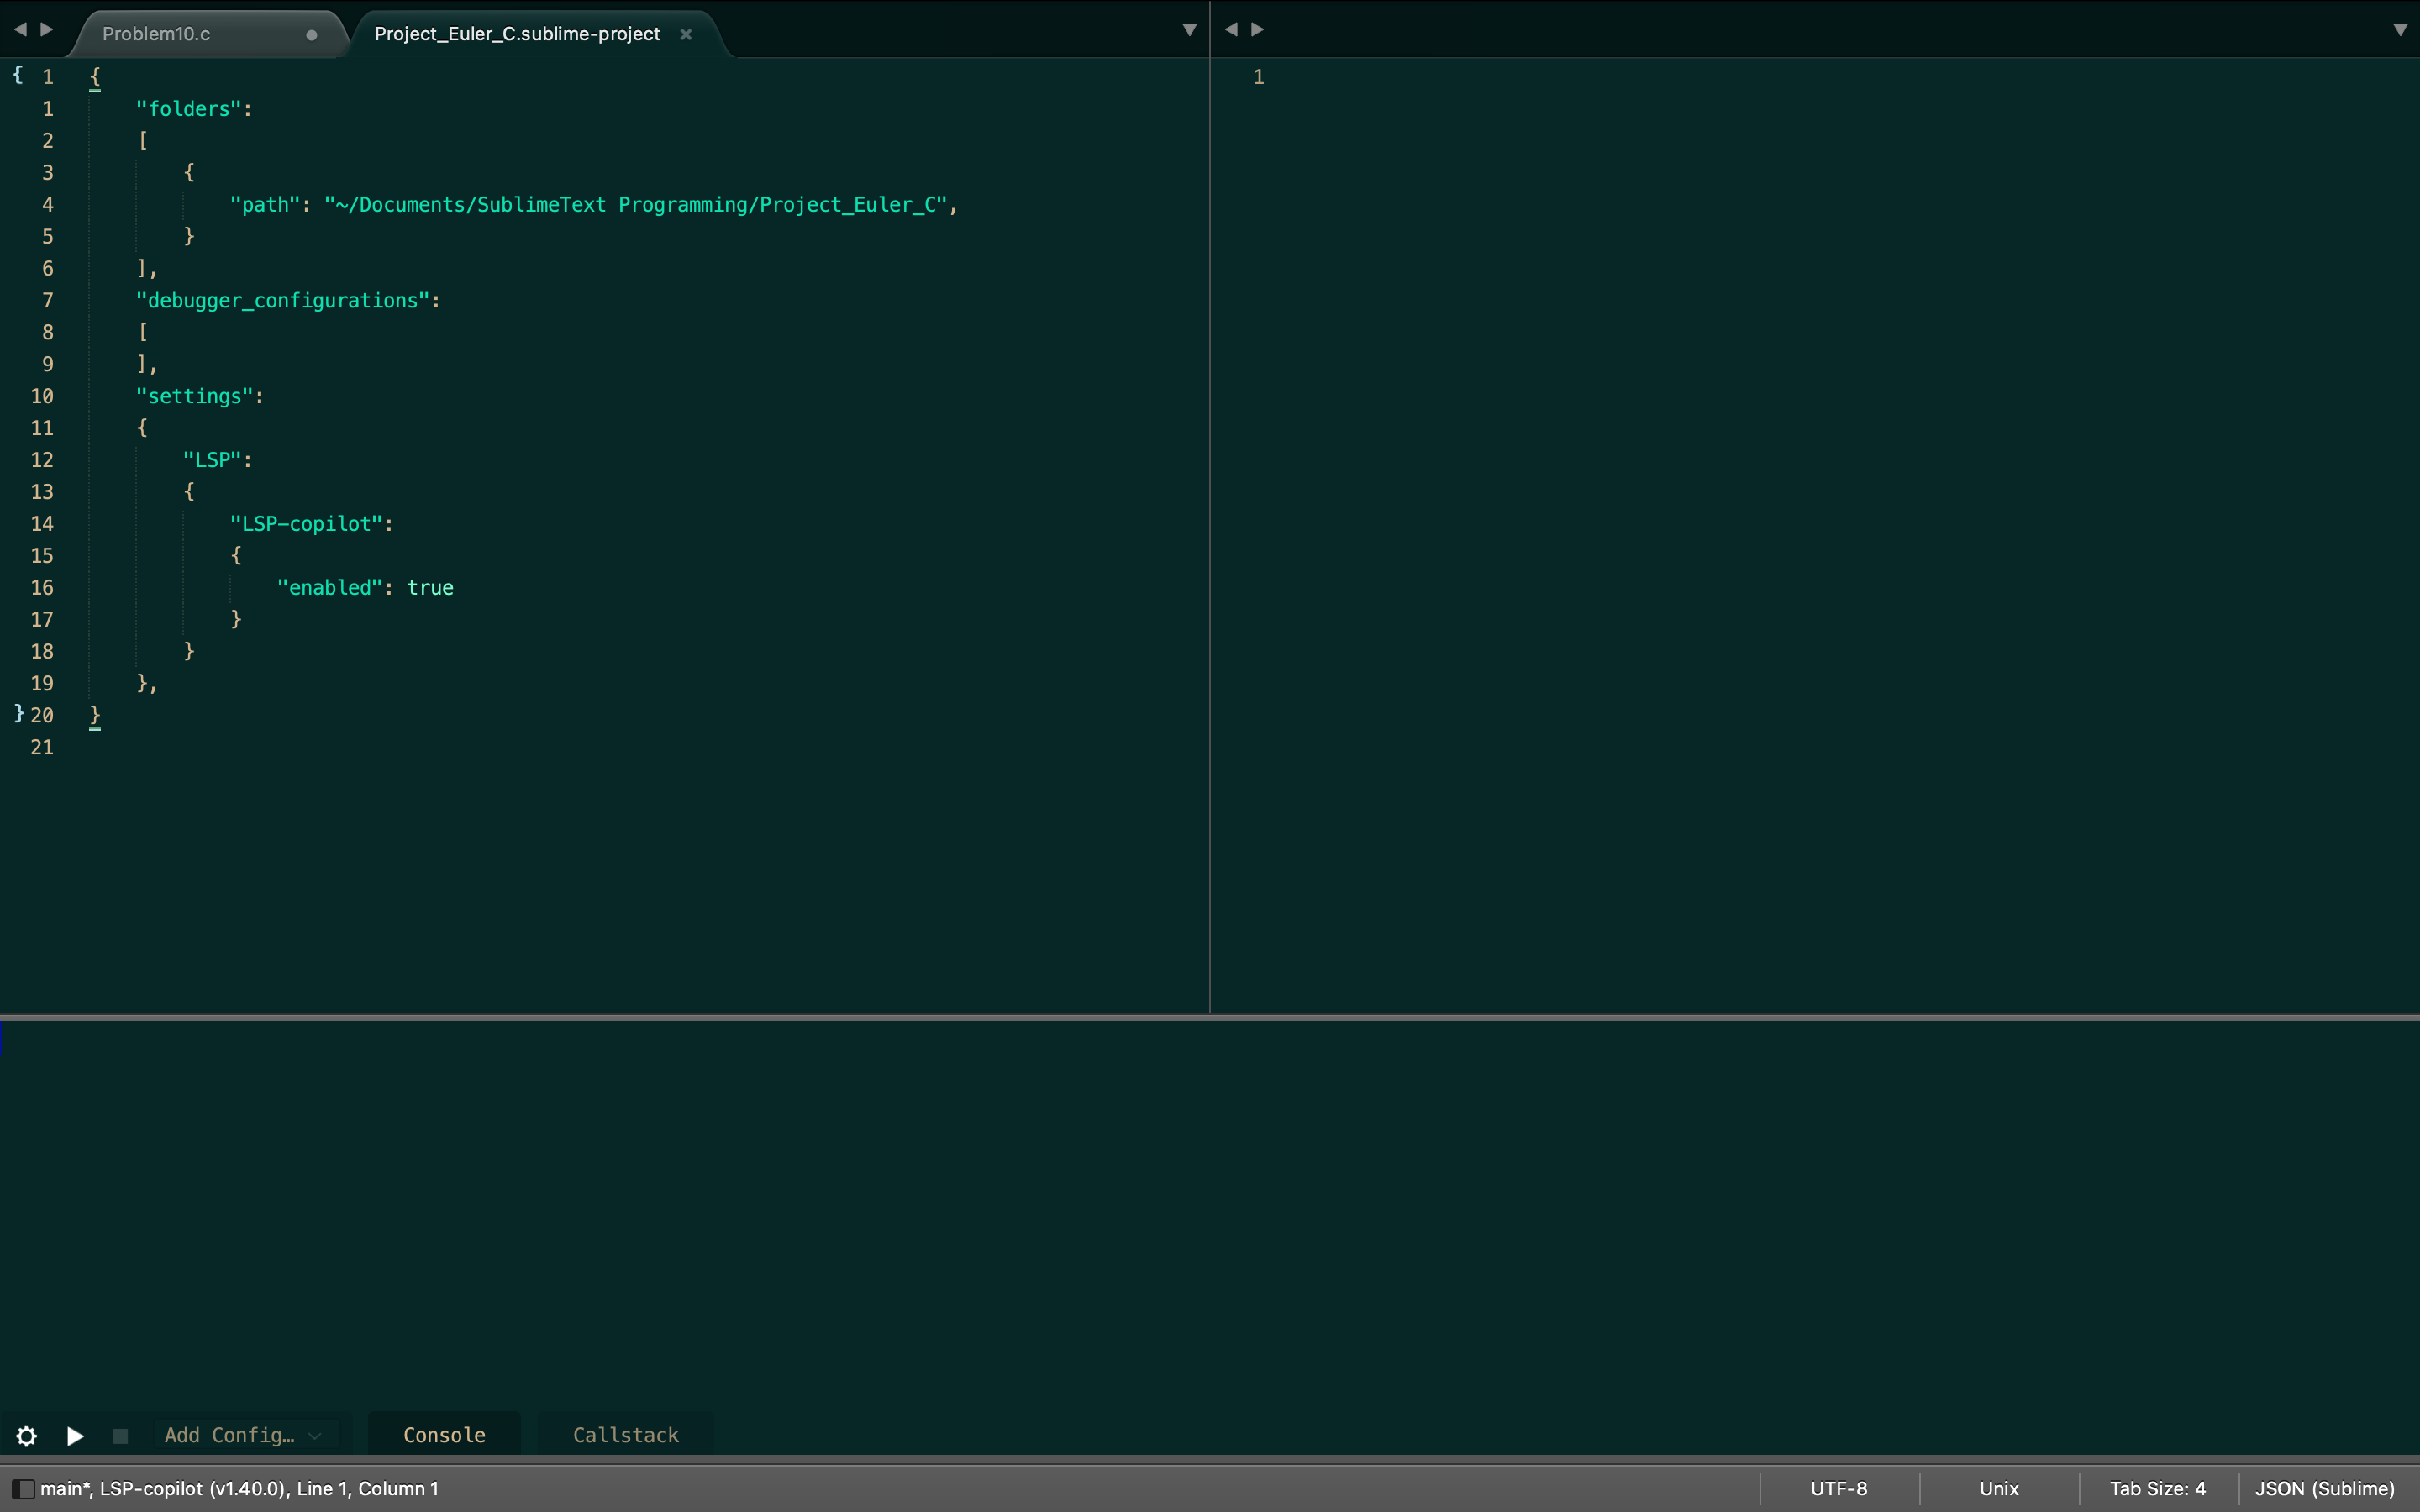
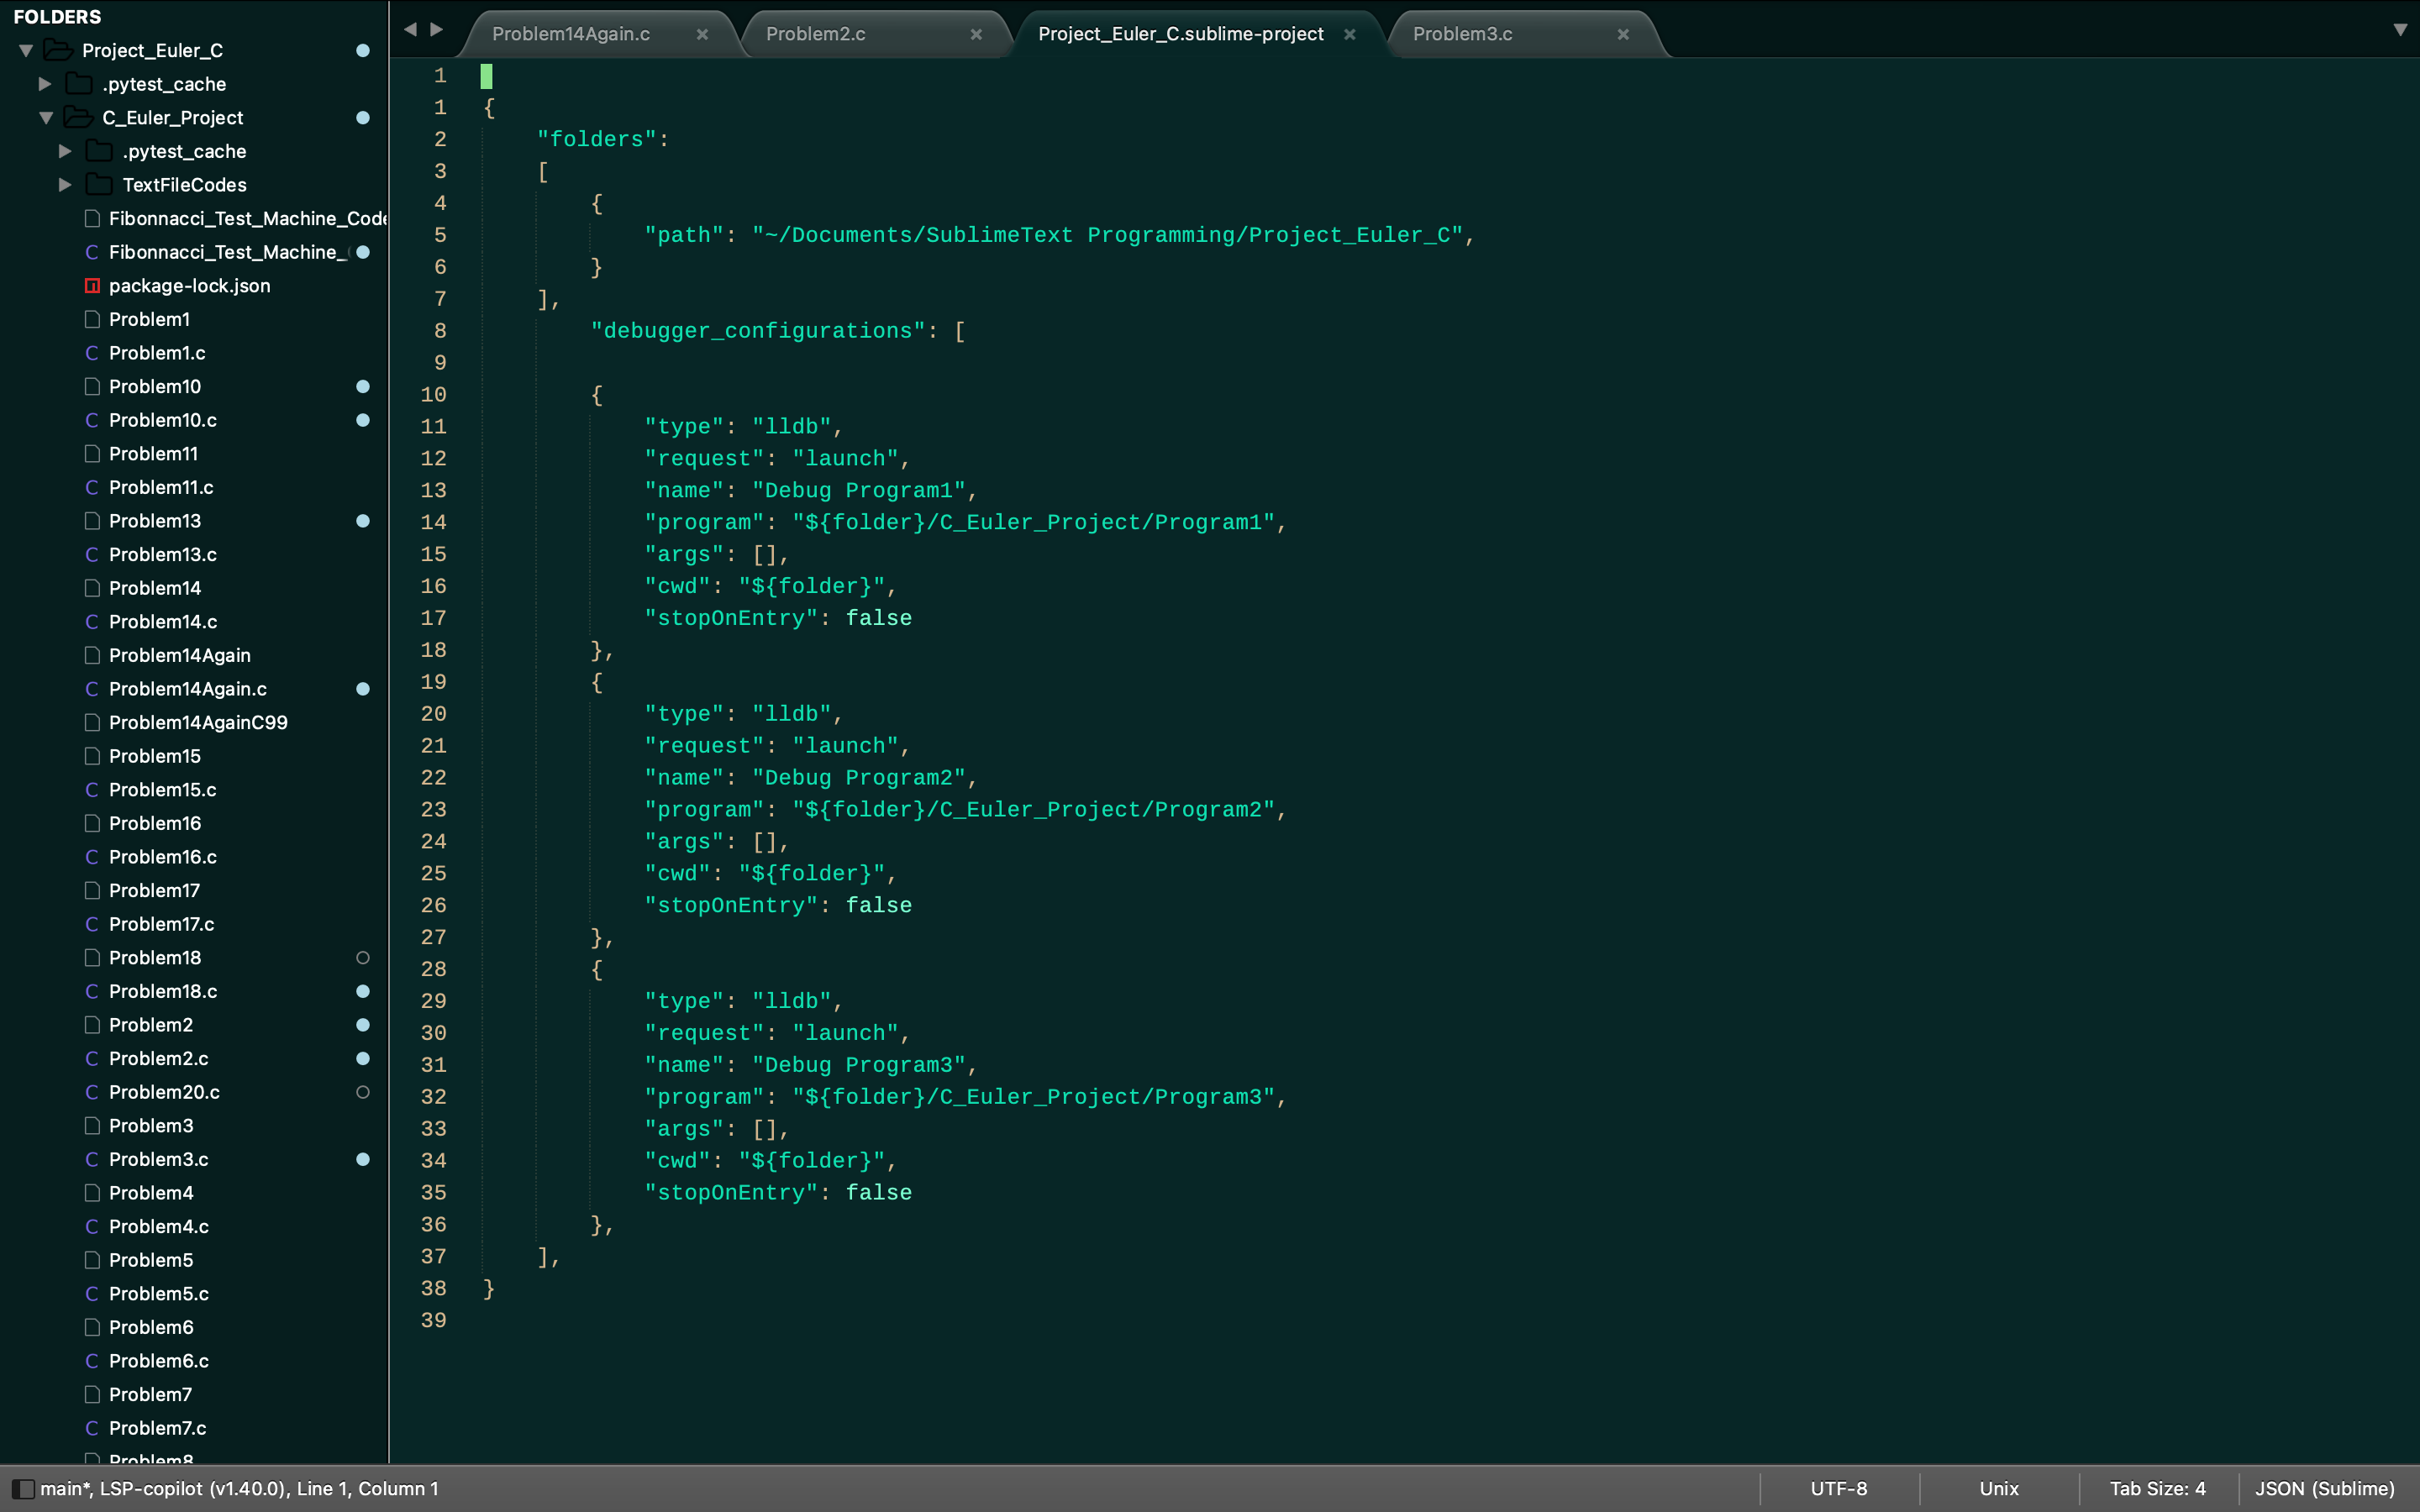
As far as my project configuration goes, I deleted the debugger and I decided to install the debugger fresh from scratch because I want to setup this up properly so here are the images reagrding the setup of the project:
Also this is the image I get when I try to run the debugger with the settings from the first image I posted here:
. Now I sort of understand the error I am getting but I am not sure what needs to be done in order to fix it.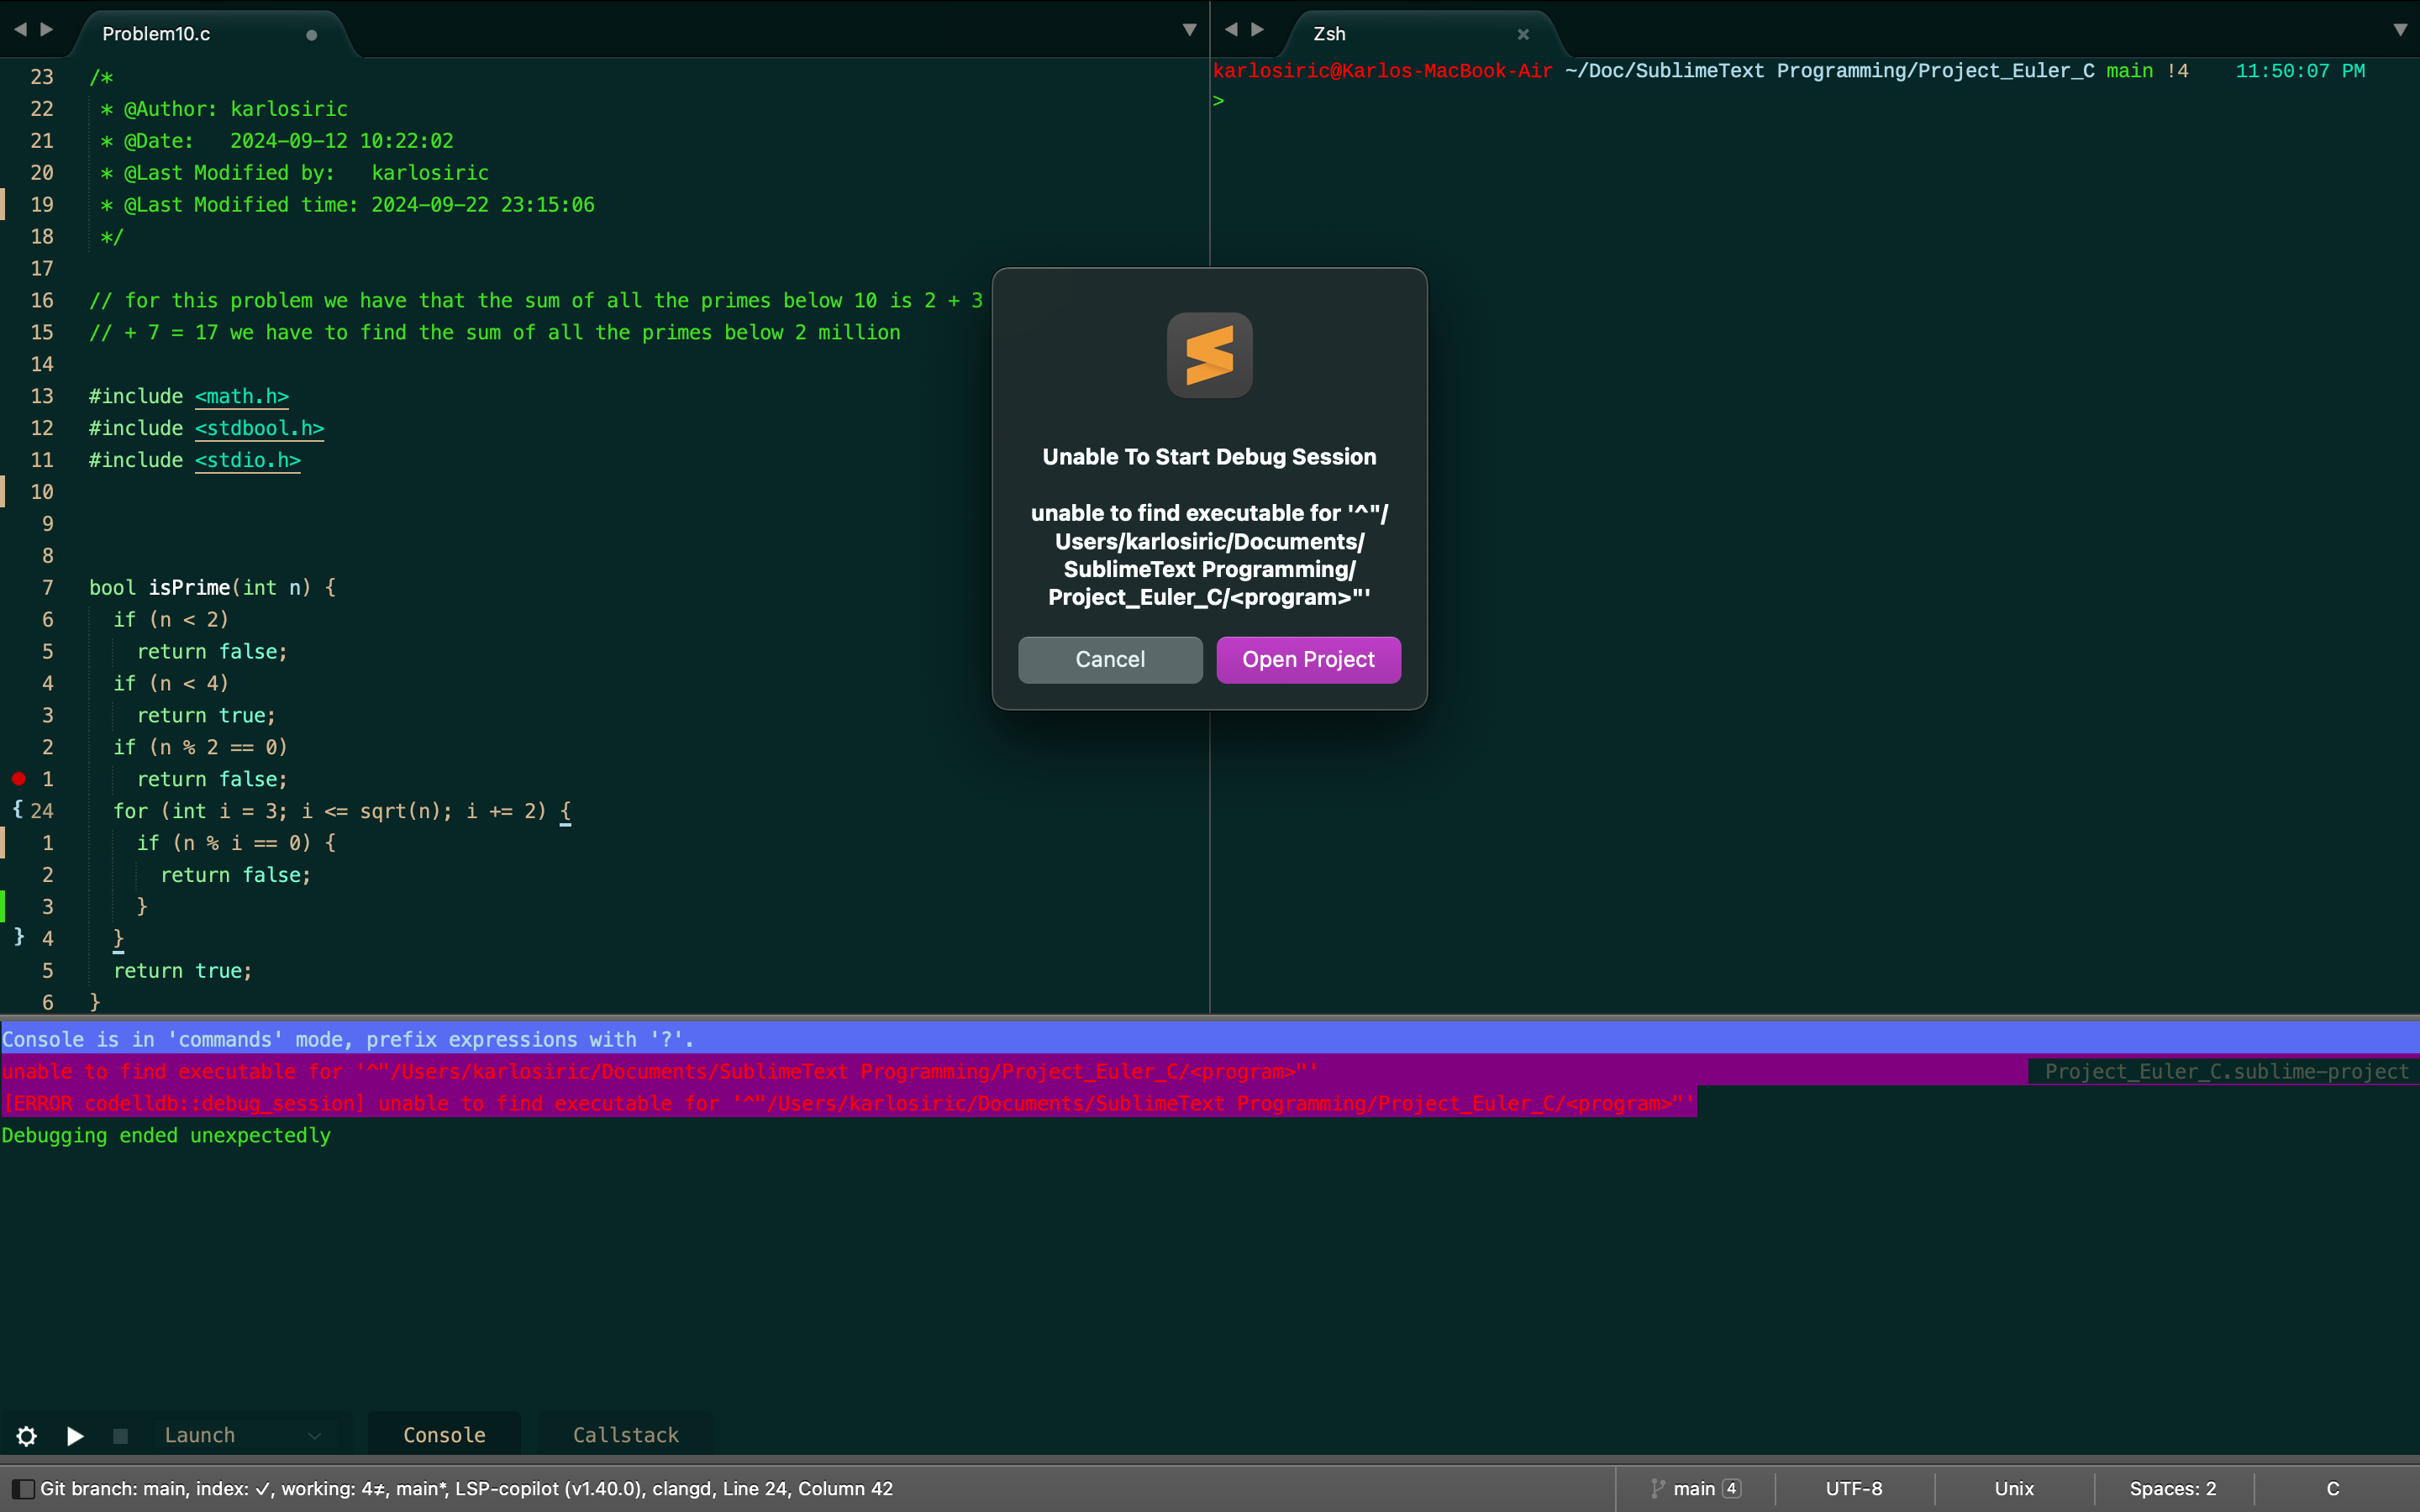
Now the first image is simply the setup when I go to Debugger: Add Configuration, I select LLDB and then Launch setting, and the second image is simply Debugger: Edit Configurations.
Now I am not sure what to setup and what not here as I have never been setting a debugger like this so I will wait for your feedback to proceed with, thanks once again. 
0 Likes
The <program> part is meant for you to fill in the actual path of the generated executable to debug.
And the command line arguments the executable needs go into the args array.
You need one of these Launch stanzas for each executable you want to debug, like
"debugger_configurations": [
		{
			"type": "lldb",
			"request": "launch",
			"name": "Debug EXECUTABLE1",
			"program": "${folder}/EXECUTABLE1",
			"args": [],
			"cwd": "${folder}",
			"stopOnEntry": false
		},
		{
			"type": "lldb",
			"request": "launch",
			"name": "Debug OTHER/DIR/EXECUTABLE2",
			"program": "${folder}/OTHER/DIR/EXECUTABLE2",
			"args": [],
			"cwd": "${folder}/OTHER/DIR/",
			"stopOnEntry": false
		},
	],
0 Likes
KarloSiric
#25
Okay I see now, well that also means each new file I make I have to compile it into an executable and then put the new configuration into the debugger with the name of that specific file in order for the debugger to work. Is there like any other way for this to work other than this or do I have to manually do this each and every time? 
0 Likes
That’s the kind of problems you’ve got as a beginner, later the number of source files per executable is greater than 1. Take it as a kind of training to get better at writing project files ;).
Of course, nothing is stopping you from writing a script that adds the correct build system and debugger stanza for each new file you want to debug.
1 Like
KarloSiric
#27
I will keep that in mind, thank you for sharing all of this and thanks for your help as well!
1 Like
KarloSiric
#28
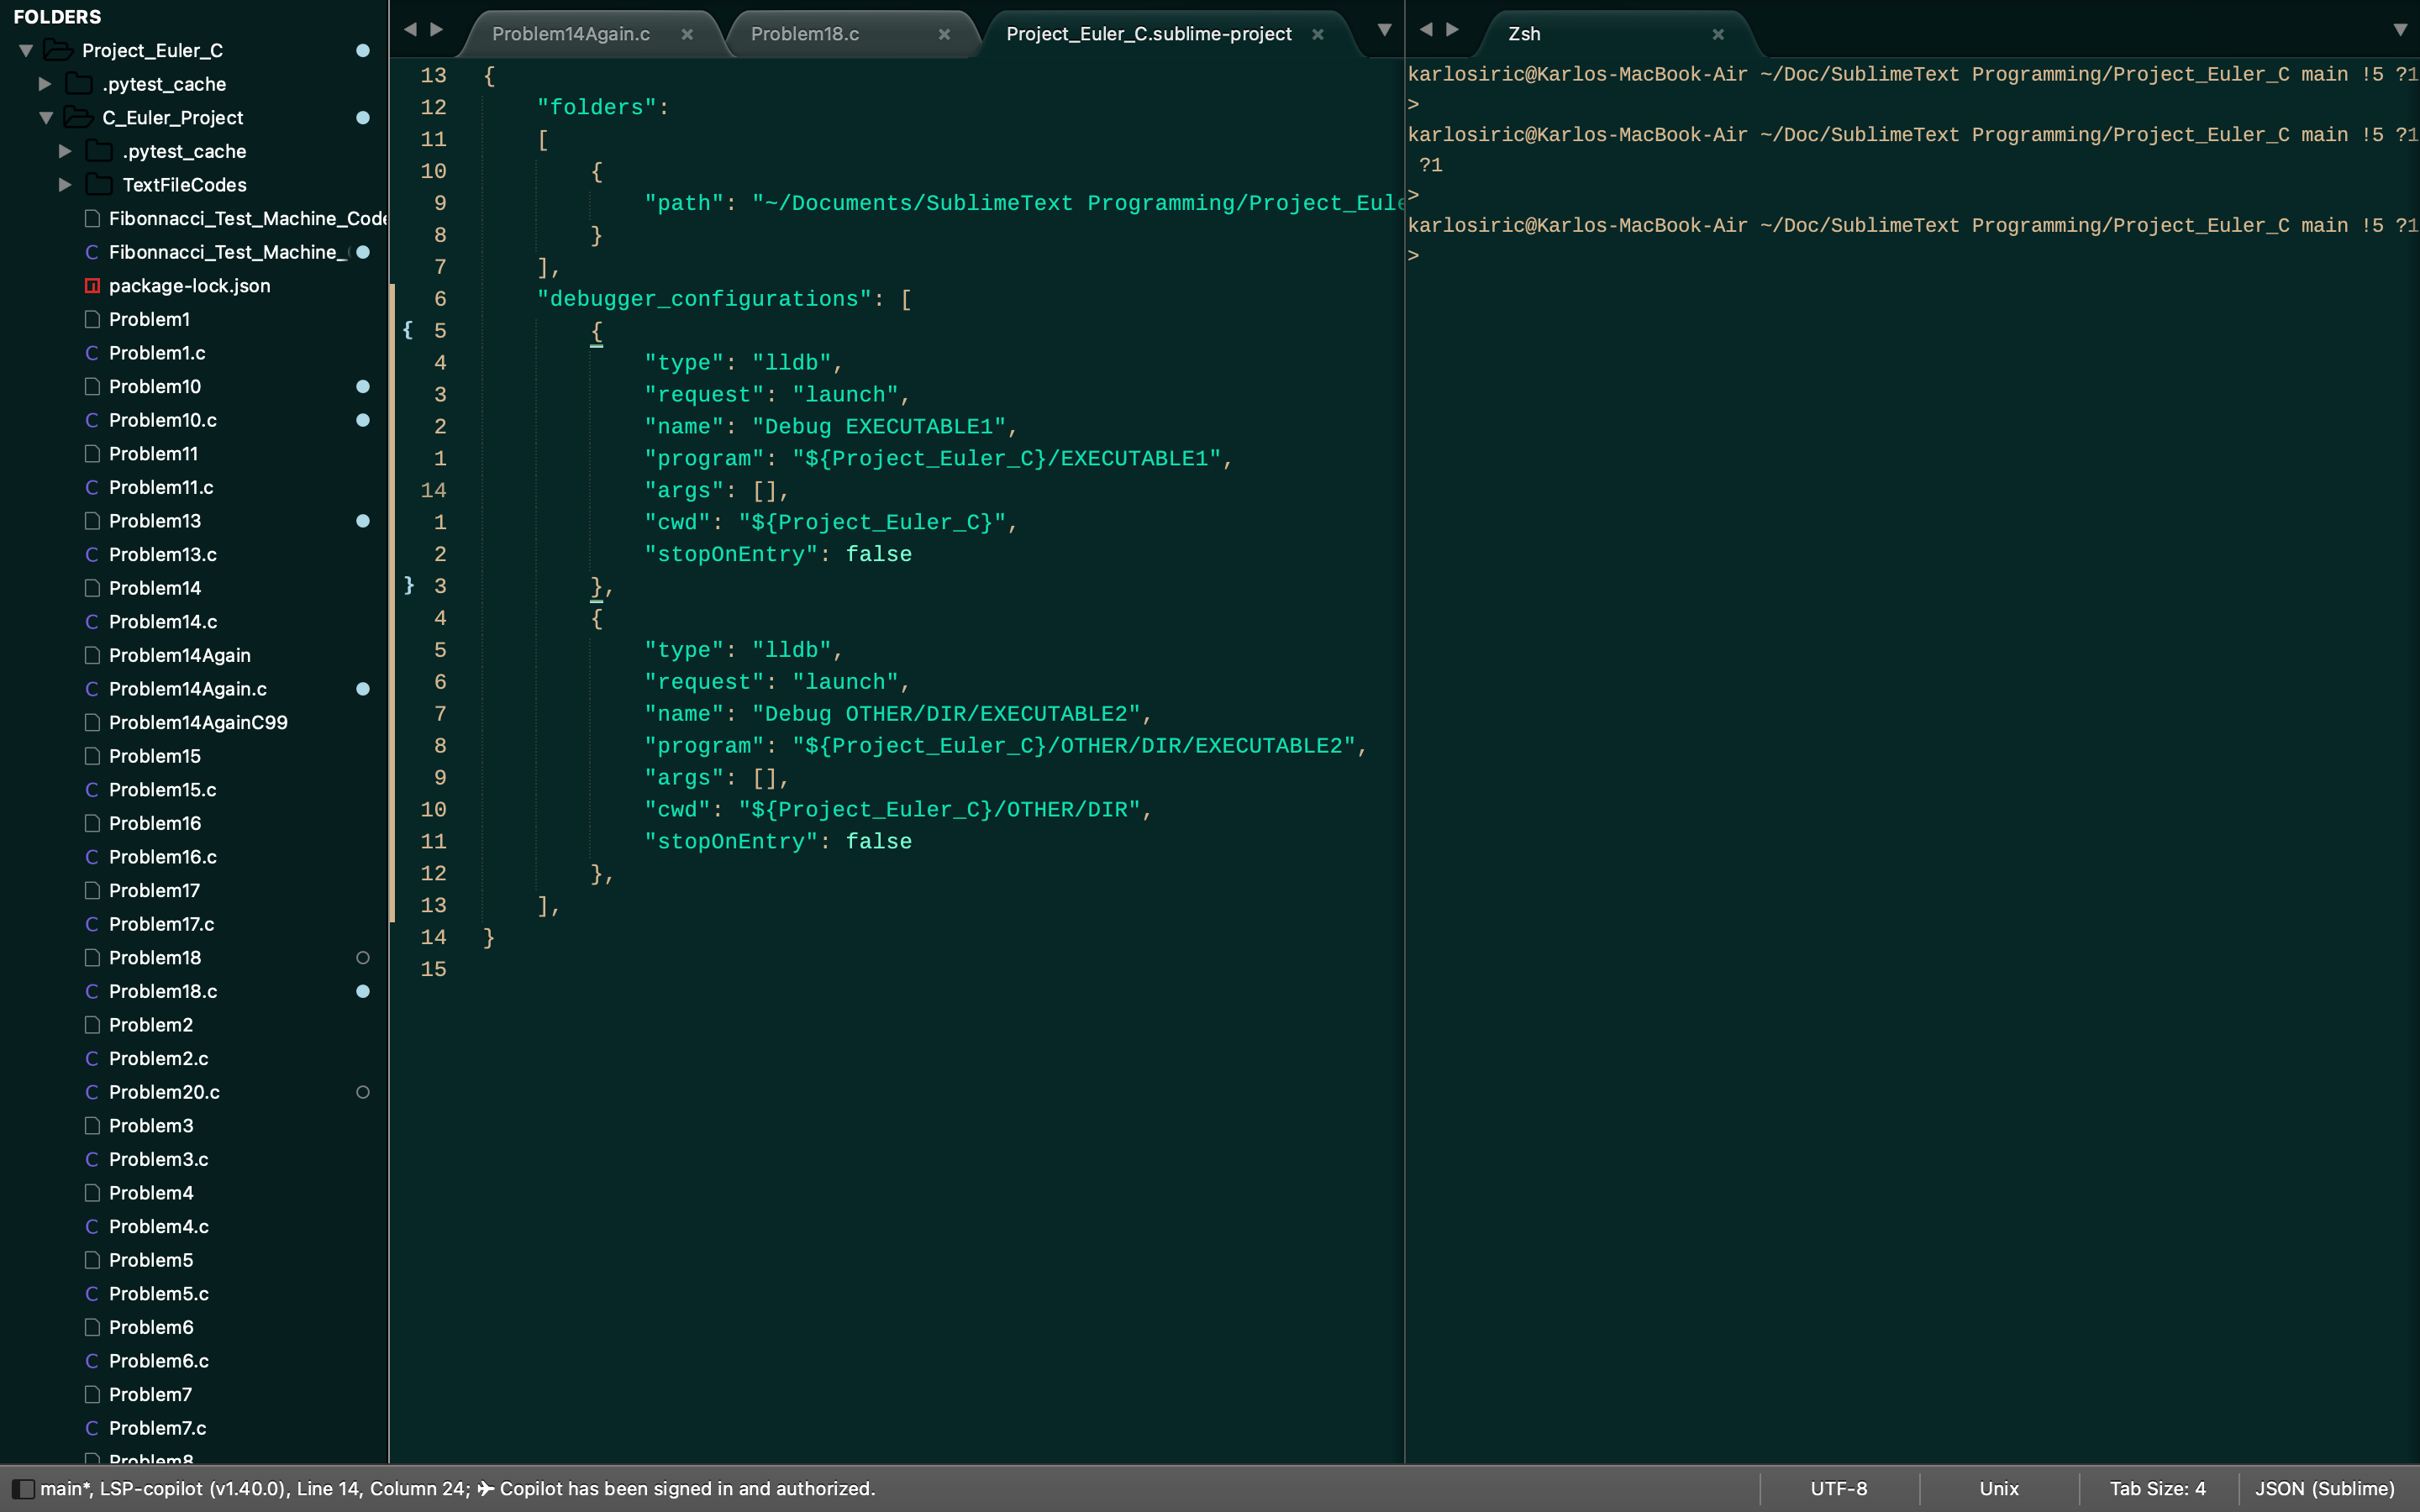
Hey, can you please looking at my program file tree at the side give an example of what should go where for this, because I am confused thouroughly with how this executables are supposed to go and what not.
It would be easier for me to understand if you give and example as to how this should be done on my case so that I know for future references because quite frankly I have never done this and I am stuck again. 

0 Likes
Sure, will do. Hmm, you’ve got quite some files
If I see that correctly, Problem1 is the executable of source file Problem1.c and so on …, and all sources and executables are in the sub-directory C_Euler_Project.
If so, the correct debugger_configurations stanza is this:
	"debugger_configurations": [
		{
			"type": "lldb",
			"request": "launch",
			"name": "Debug Program1",
			"program": "${folder}/C_Euler_Project/Program1",
			"args": [],
			"cwd": "${folder}",
			"stopOnEntry": false
		},
		{
			"type": "lldb",
			"request": "launch",
			"name": "Debug Program2",
			"program": "${folder}/C_Euler_Project/Program2",
			"args": [],
			"cwd": "${folder}",
			"stopOnEntry": false
		},
		{
			"type": "lldb",
			"request": "launch",
			"name": "Debug Program3",
			"program": "${folder}/C_Euler_Project/Program3",
			"args": [],
			"cwd": "${folder}",
			"stopOnEntry": false
		},
		...
	],
You could also add build_systems stanza to build the executables, like so:
	"build_systems": [
		{
			"name": "Debug Build Program1",
			"cmd": [
				"clang",
				"-Wall",
				"-pedantic",
				"-g",
				"-std=c17",
				"-o",
				"./C_Euler_Project/Program1",
				"./C_Euler_Project/Program1.c"
			],
			"working_dir": "${folder}",
		},
		{
			"name": "Debug Build Program2",
			"cmd": [
				"clang",
				"-Wall",
				"-pedantic",
				"-g",
				"-std=c17",
				"-o",
				"./C_Euler_Project/Program2",
				"./C_Euler_Project/Program2.c"
			],
			"working_dir": "${folder}",
		},
		...
	]
The elements of the array cmd is the command line for clang to compile each source file with debug information enabled -g and the C standard set to C17 (-std=c17) and pedantic warnings enabled.
1 Like
KarloSiric
#30
Yeah quite some files because I am doing this C programming for this Project Euler which is slowly starting to be demanding so I need the debugger for that reason. Also the stuff you have provided, I have copy pasted it and still I get the same error as before with not being able to locate the project and so fort. 
0 Likes
Then we need to look at the exact path in the project configuration (which is cut off in the screenshot) and the actual path of the project configuration in Project_Euler_C.
Posting the actual error message should solve that problem, I guess
0 Likes
KarloSiric
#32
Okay yeah, I forgot to post the error, but the error makes no sense to me at all because the path seems to be set correctly, anyways here are the screenshots:
Here you can see that the path is set correctly in the debugger configuration.
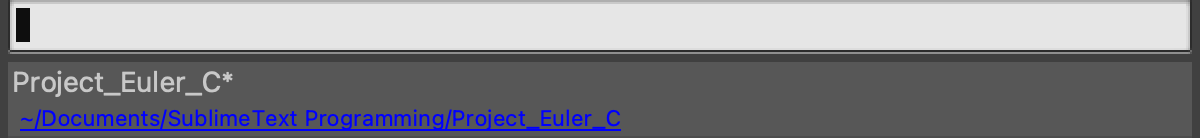
Here is the screenshot of the path of the project:
And finally here is what the error says:
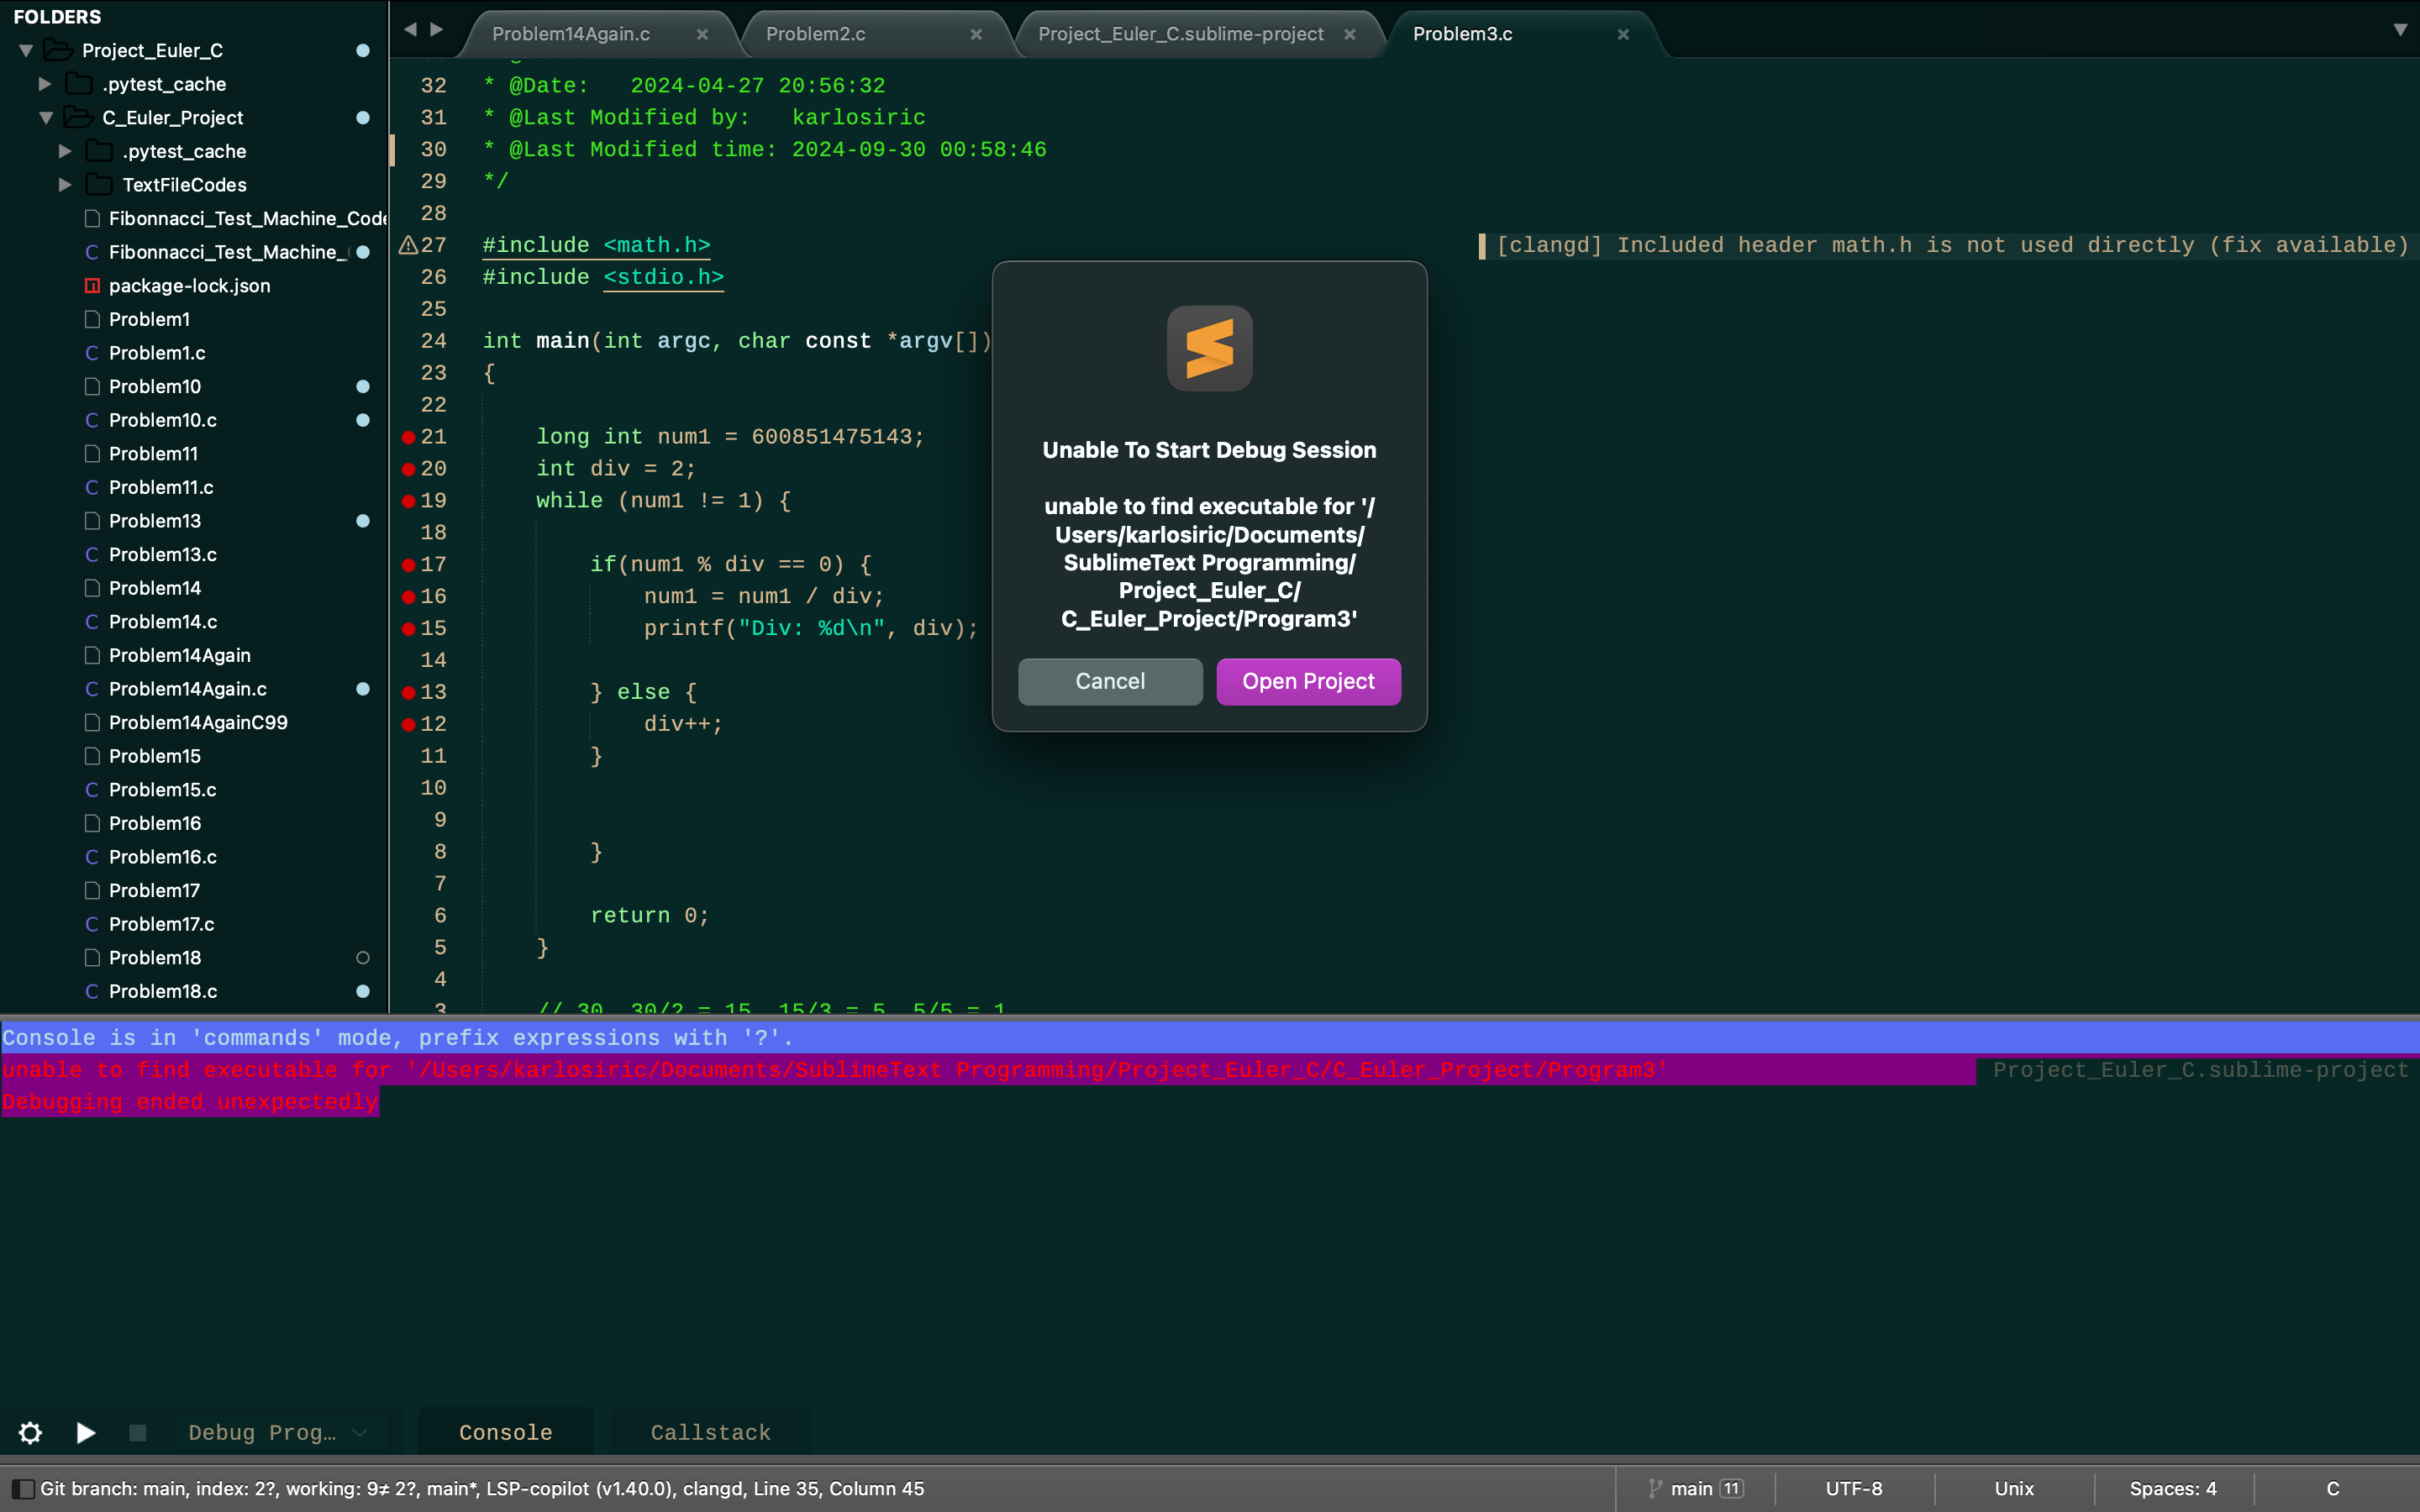
As far as I can tell everything seems to be in order with the path, guess I am blind 
0 Likes
We both are - I needed quite some time even now knowing that the path must be wrong
Your sources and executables are called “ProblemN”, but I used “ProgramN”. So changing all file names to the real ones should solve that.
0 Likes
KarloSiric
#34
I really am blind  . Thank really appreciate your help on this, I will give it a try later but it should work now, I will let you know if there is still something left.
0 Likes
KarloSiric
#35
Also, wanted to ask you now that we spent so much time here talking, does it work the same way for Java as well and for that matter other languages too? Just the debugger is not the same I probably won’t use LLDB for Java although I am not sure since I am not that knowledgable on debuggers. So can this work for Java and python and other languages? 
Also it seems that the debugger works now but it doesn’t showcase the variables in the watch window, when I add a variable to watch it says not available. Also there is no like step in step out and all those options for the debugger?
Another thing I have to say is that it runs but it doesn’t showcase anything per say, I have the screenshots it’s easier to understand it like that.
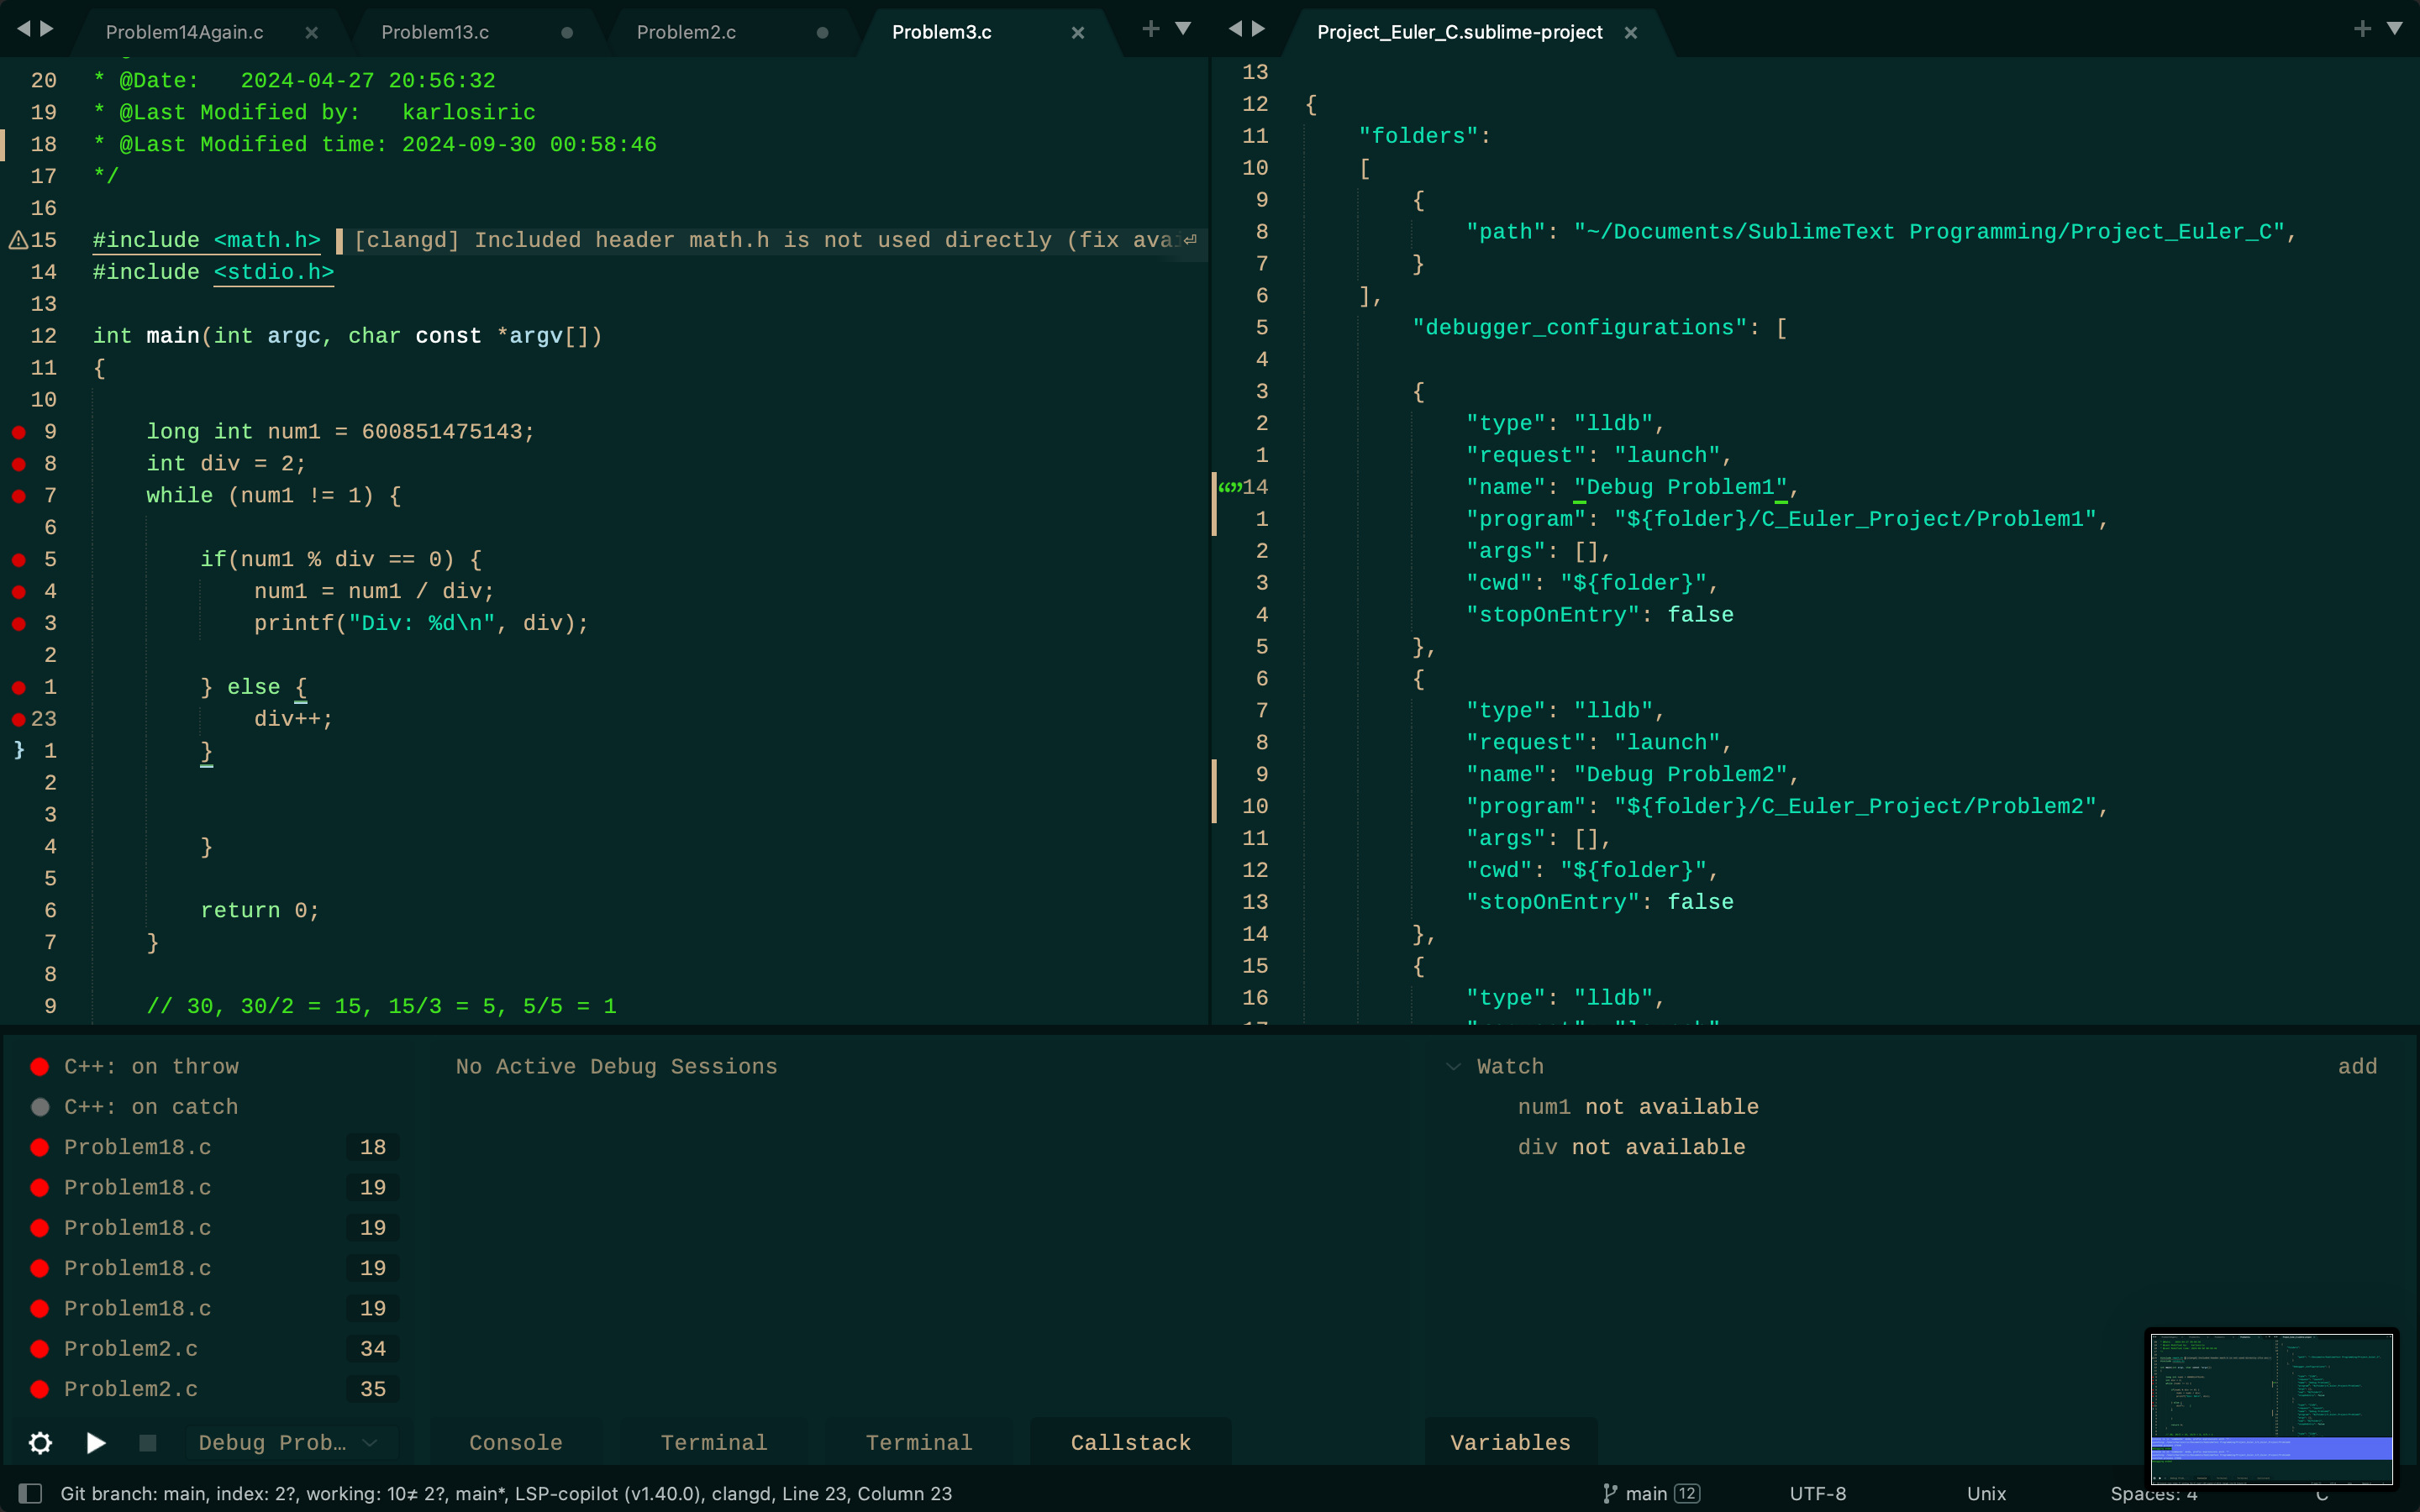
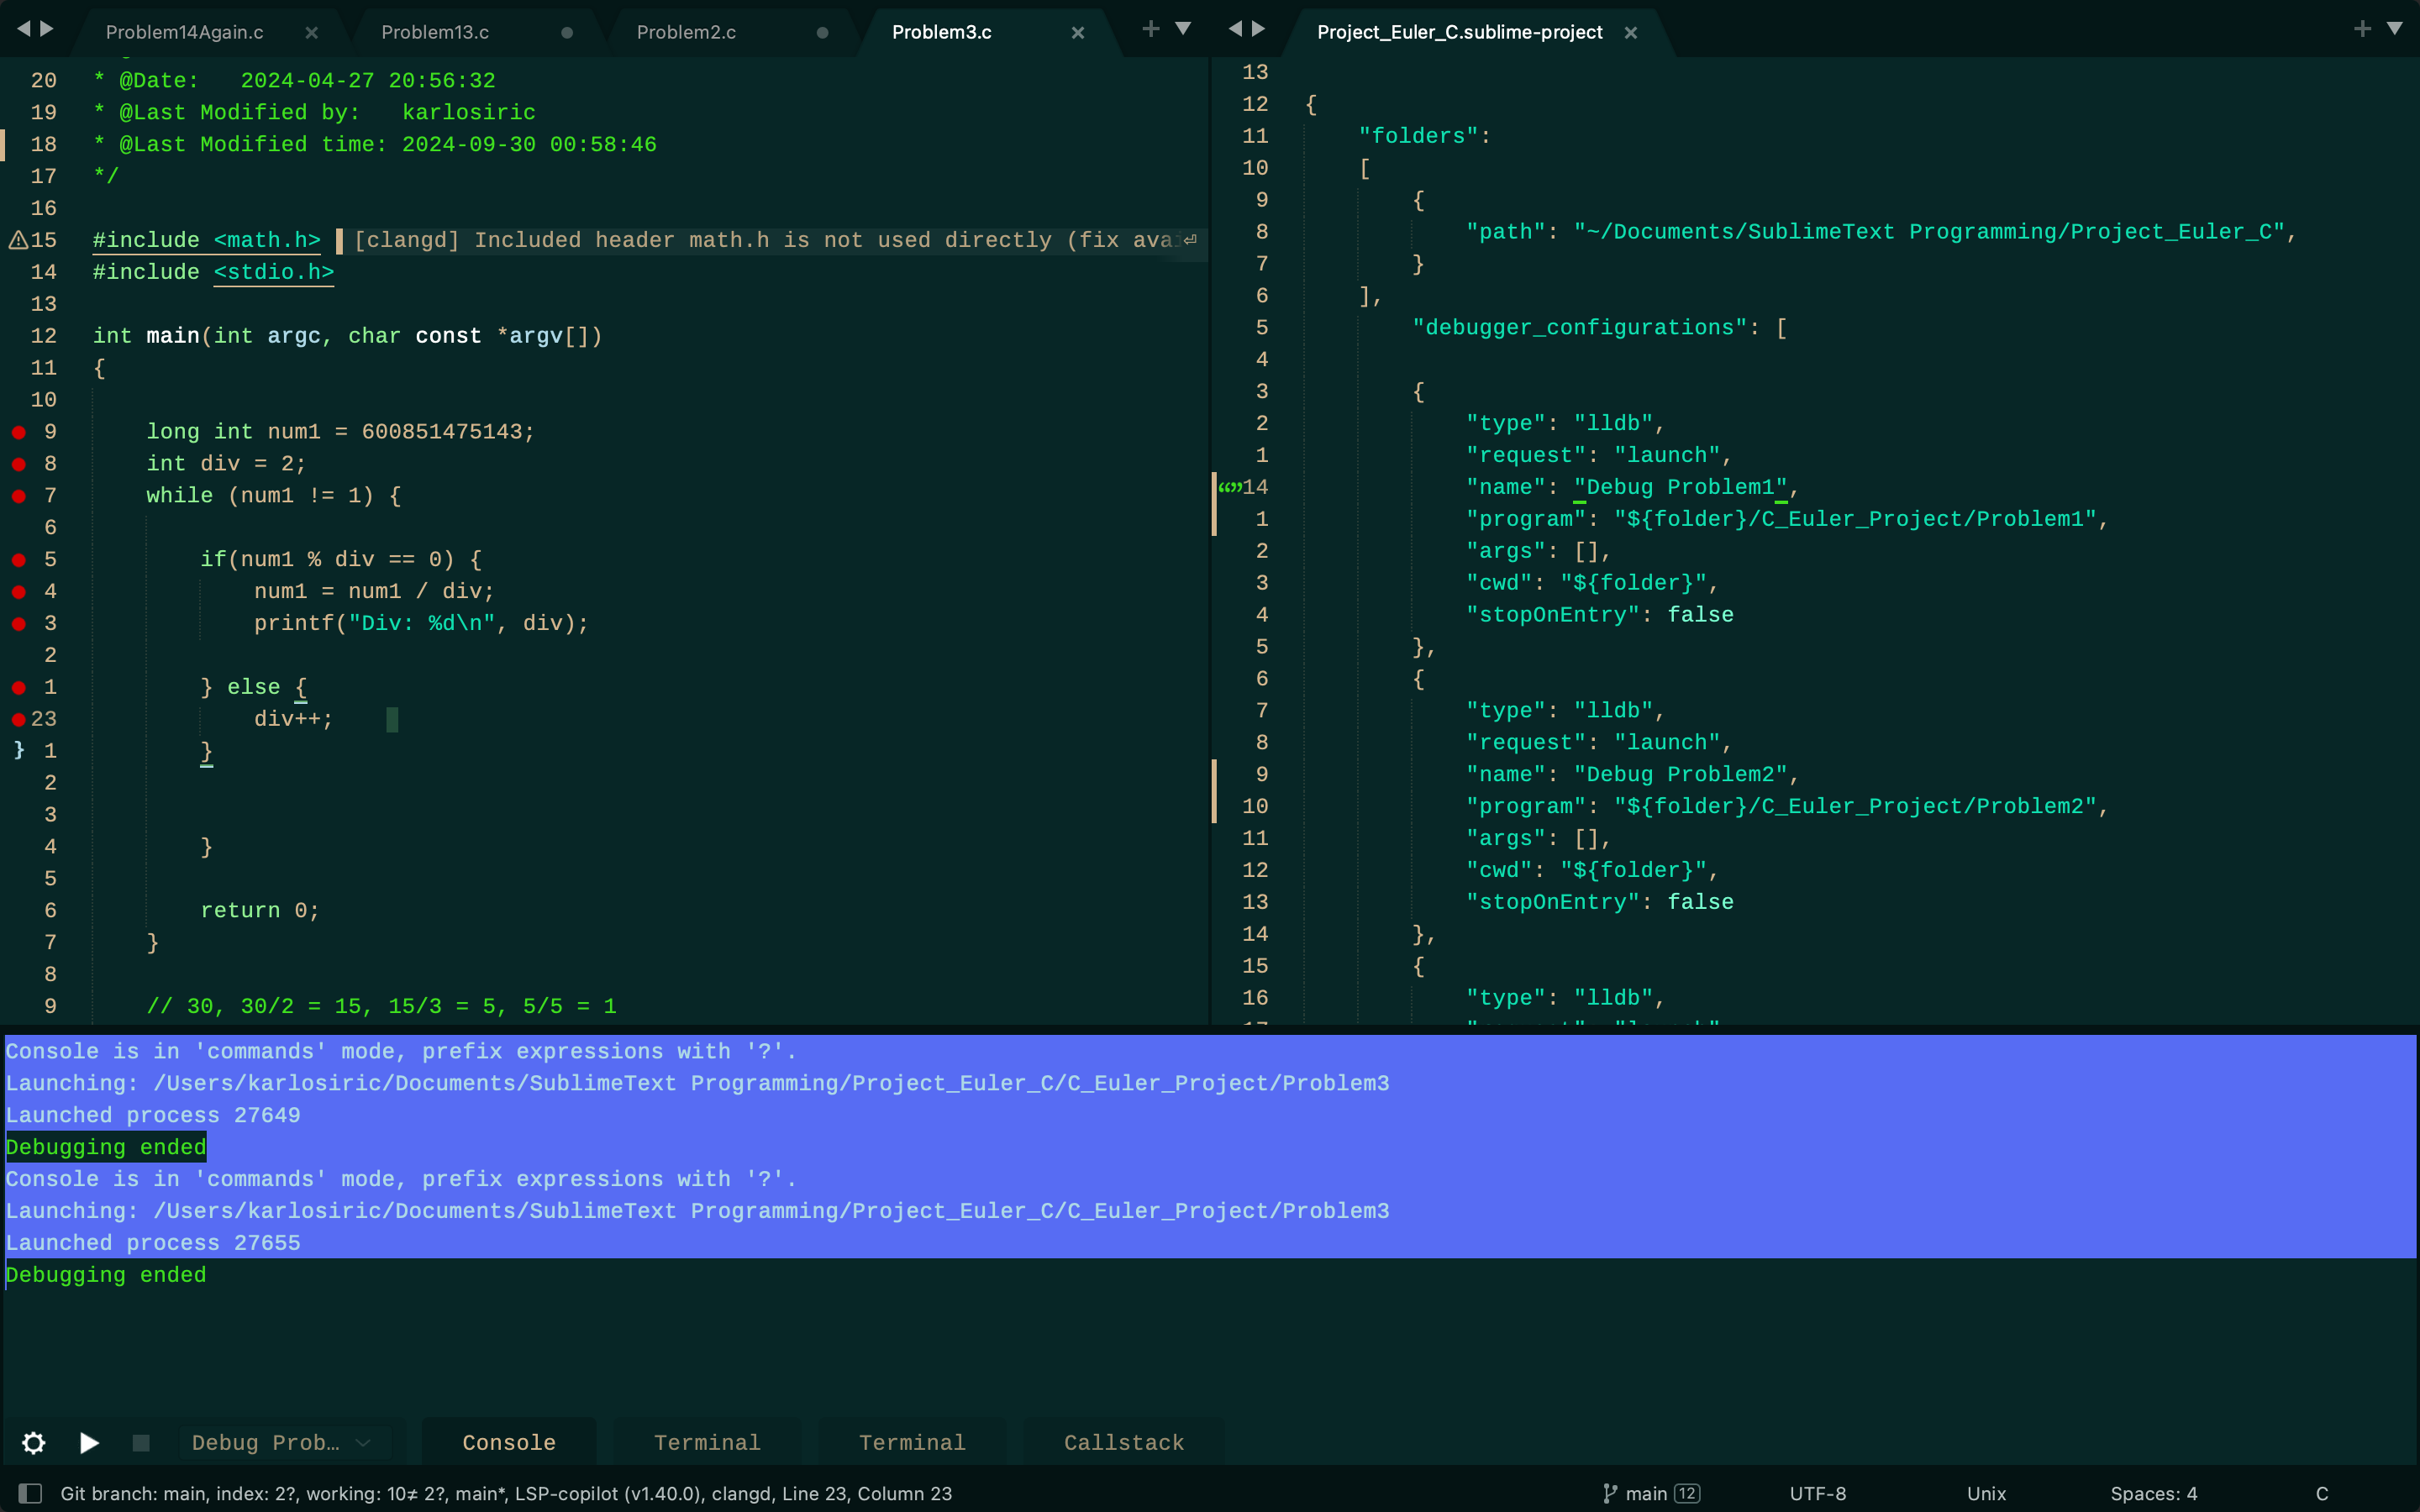
Like for this task I was doing just for testing purposes I put breakpoints all over to see how it will do but it seems it doesn’t like I thought it would, it doesn’t showcase anything to me in a sense that it shows which are being incremented which arent I have a feeling it doesn’t go step by step but just runs the program doesn’t really debug it, although maybe I got it wrong, I was used to the debugger from VS Code so maybe that is the problem. 
0 Likes
Yes, the main configuration is more or less the same, but there are subtle differences. You need to read the documentation of each debug adapter program. See https://packagecontrol.io/packages/Debugger, e.g. https://code.visualstudio.com/docs/python/debugging and https://github.com/Microsoft/vscode-python for Python.
Generally, what is called configuration in these VS Code documentation is Sublime’s debugger_configurations.
0 Likes
It says “no active debug sessions”, which means that the debugger doesn’t run, so you can’t see anything. If you look at the picture above Debugger for C you can see how the buttons to step through the executable and the watched and local variables are supposed to look like. In the “console” tab you should see output of your executable and the debugger, maybe you see what is wrong there. But looking at the window with the output of Problem3, I do not see the output of printf anywhere, and there should be at least one even number printed. Could it be that the executable is too old and does not reflect the source code? Did you rebuild the source before starting the debugger?
And a remark: you should really format your source code, for example by setting format on save in the LSP configuration (Settings -> Package Settings -> LSP -> Settings):
{
  "lsp_format_on_save": true,
...
}
0 Likes
KarloSiric
#38
So I have rebuilt the source code, also I am thoroughly confused by this right now, I do not understand why the debugger would not run. I have made a new executable for the problem and added it to the configuration but also again nothing, same thing happens.
I have no idea, I can see your image and I know how a debugger is suppose to function but this one that I have is not doing anything. It runs and ends instantly or something.
Also thanks for the remark on formatting, I had it before but didn’t like it so I turned it off, I will give it another try tho
0 Likes
Sorry I made an error, the output of the program is in the “Terminal” tab, do you see anything there?
To get another format, you need a file named .clang-format in the project directory’s root, containing the configuration. I’d start with one of the styles of https://clang.llvm.org/docs/ClangFormatStyleOptions.html#configurable-format-style-options
So, the file should look like
BasedOnStyle: LLVM
0 Likes
KarloSiric
#40
Yes I see the output of the code in the terminal tab of the debugger, but I do not see these watch variables, the code doesn’t stop when it hits the first break, like nothing, it just compiles, runs and outputs the result to the terminal as if I pressed build system and not debug so no idea what seems to be going on here.
As for the formatting, yeah I will give it a read about the clang formatting, the lsp one is not so bad, I have no idea why is disregarded it in the first place.
0 Likes