Hello, need help setting up the debugger plugin for C programming/development. When I install the adapters and everything set the break points and run the debugger it says: Could not start debugger process, does the program exist in filesystem?
Error: spawn gdb ENOENT
Aha I see, yeah I don’t have GDB installed it doesn’t exist at all, I will try installing it and then see about fixing the issue. I will keep you updated.
So apparently there is not gdb for M1 Macbook it has not been implemented, people say lldb is available and when I ran lldb in the terminal it works. Now inside sublime I have installed lldb configured it, and when I debug I still get the same error as for gdb.
I’m on MacOS with an M1 too. What is called by the extension is codelldb, it’s configuration in your .sublime-project file is the same (except for constants like ${workspaceFolder}) as for e.g. VS Code: https://github.com/vadimcn/codelldb/blob/master/MANUAL.md
Does lldb work in the terminal, when you are calling it like lldb YOUR_EXECUTABLE and then running it using run at the lldb prompt? You will need to set the permissions, or the debugger hangs.
Oh , great I didn’t know about lldb until recently, tested it yesterday in my iTerm2 terminal and when I typed it in I guess it entered the lldb state, had like (lldb) prompt in my terminal so I guess it’s fine.
I will give it a try with this configuration and I will let you know how it went.
Oh, and the actual binary used by the adapter is ~/Library/Caches/Sublime\ Text/Package\ Storage/Debugger/lldb/adapter/codelldb, this should have been installed by the LLDB adapter. With
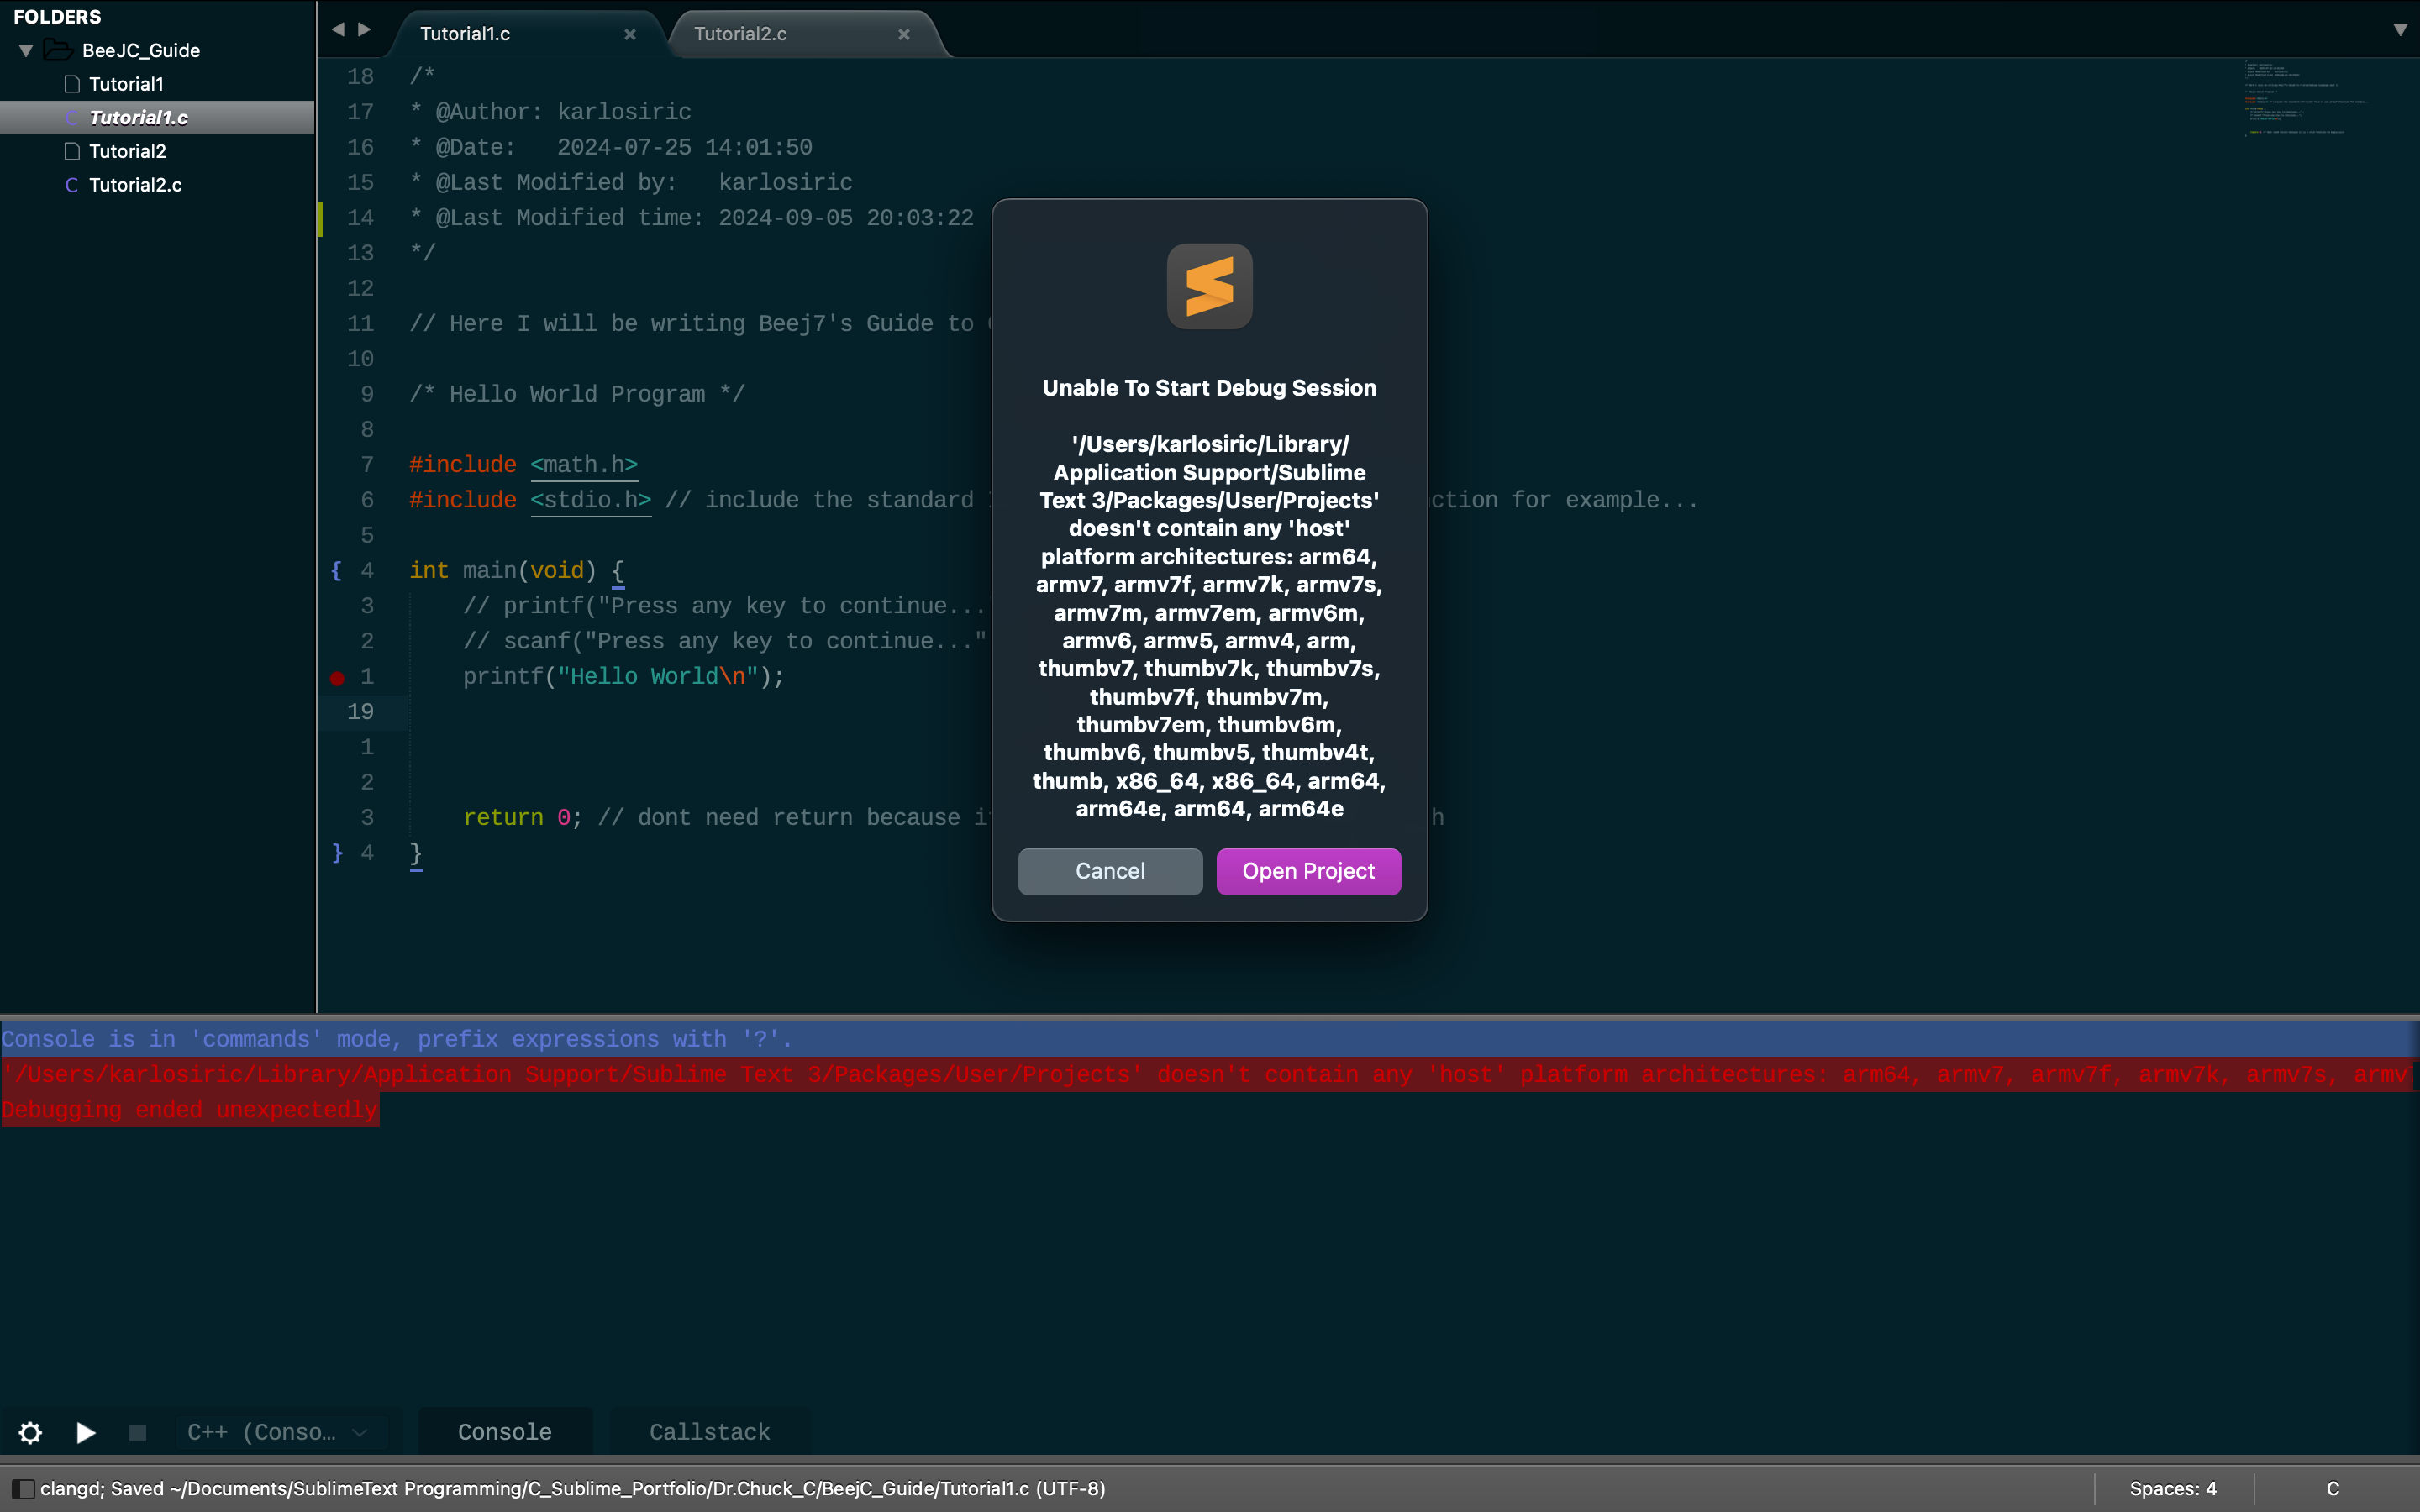
Hey , so I have been really busy with work and other related stuff I forgot to give it a try with the debugger for C, now I have and I seem to be having an error every time despite adding the configuration that you posted and I get this message, any idea on what this can be and how to resolve it?
Okay but what if my program is named differently, like everytime I rename or create a new program, I have to rename it also inside the debugger configuration or? Cause if so then that’s really a pain haha
I compiled the file I have it as Tutorial1 , it compiles instantly when I press build it compiles and executes so I don’t understand why it is is giving me this error at all.
You have one debugger configuration per project, so in reality you do not add that many executables. But basically, yes
As I don’t know your project configuration file, all I can say from the error message is, that ~/Library/../User/Projects is not an executable (but I guess a directory).
I have been working in software for at lest 40 years now. I am currently writing a simulator / debugger for the Dallas DS5001 processor to use at work because it has absolutely NO debug capabilities built in. I have been reverse engineering the Keil extensions to the OMF51 file format by Inntel (not their code).
I can already debug at the assembler level, I already know how to associate opcodes with source file line numbers… just a few other details to figure out and I will have a full source level debugger I can use…
I can say that after 40 years of debugging code on a daily basis that the single most horrendously IMPOSSIBLE to use debugger I have ever experienced is GDB. It is even worse than the ICE for the NEC75x which only displayed opcodes AFTER you stepped them lol.
It does not matter what front end interface is put on it, They are all just lipstick on a horrendously ugly PIG.
OTOH, if there were a built in GDB interface in sublime text *NOT a plugin) that showed the disassembly or C sources in one dedicated area of a tab, the registers in another dedicated area of the tab, a configurable dump in hex bytes / words / dwords in another area of the tab and a PROPER display of the top N items on the stack whether they were part of a dumb STACK FRAME or not…
Interesting, I don’t know much about what you just said quite frankly, not that experienced, but nontheless, do you know which debugger that is not GDB is go to choice for debugging in C, since I have trouble setting up the debugger I debug using printfs
Depends on your system. For linux you have GDB, GDB, GDB, GDB or GDB. And the only front ends you have for this are horrendously unweildy, unmanageable and imho utterly unusable interfaces.
I am actually in the process of writing a debugger for the 8051 micro controller and have been reverse engieering the Keil custom AOMF file format. I pretty much understand 100% of this format now except the way it describes structures and Ill get that part figured out soon enough. My debugger is actually a simulator for the Dallas DS5001 controller and will have source level debug or symbolically disassembled asm level (that part already works).
Not since the good old days of dos has there been a single decent debugging environment other than printf’s. For example, debugging assembler is pretty much a lost cause with GDB. It can do it but it moronically assumes that you are debugging the output of a C compiler and assumes there is a “stack frame” and in some instances it will just get downright uppity with you if you ask it to jump to an address it does not think contains code.
EVen with gdb -tui (the curses interface) it wont display source or disassembly in this window, a selected memory range in that window, registers in this window over here and a display of the top N items on the stack. If it does not recognize a stack frame it wont display any of it. When not using the curses interface it simply PUKES OUT the data you want to see every step, scrolling it all off view as it goes. This makes debugging HORRIFACLLY PAINFUL because NOTHING stays situated in one place other than the sources you are stepping through. everything else just SCROLLS off view constantly.
A good debuger will have a memory window and if anything changes in that memroy window it will give you are VISUAL INDICATION of that change.
Gdb has dozens of front ends, the vast majority of them are abandoned efforts to give GDB a usable interface and every single one of them utterly failed to even come close to doing so before they were abandoned.
If Sublime HQ can produce a clean interface for GDB that puts everything you need to be watching every gime you single step in a dedicated STATIC LOCATION on the display that would be freeeeeeeeking awesome. I dont think it will ever be made however and if anyone writes a plugin to do this it will probably be just as bad as every other interface the unwashed masses every produced for GDB.
< / rant > : )
Wow I find it interesting to read this, obviously I had no idea how many of these things work but now that I read what you said it does make a bit more sense to me. Before I used Sublime I started with VS Code, and that’s a whole story on it’s own but I didn’t really like vs code.
Still it is not fair to compare Sublime with VS Code as they don’t technically fall under the same category of editors. I prefer Sublime 1000x over vs code don’t get me wrong, but the one thing I actually miss from vs code is the debugger itself.
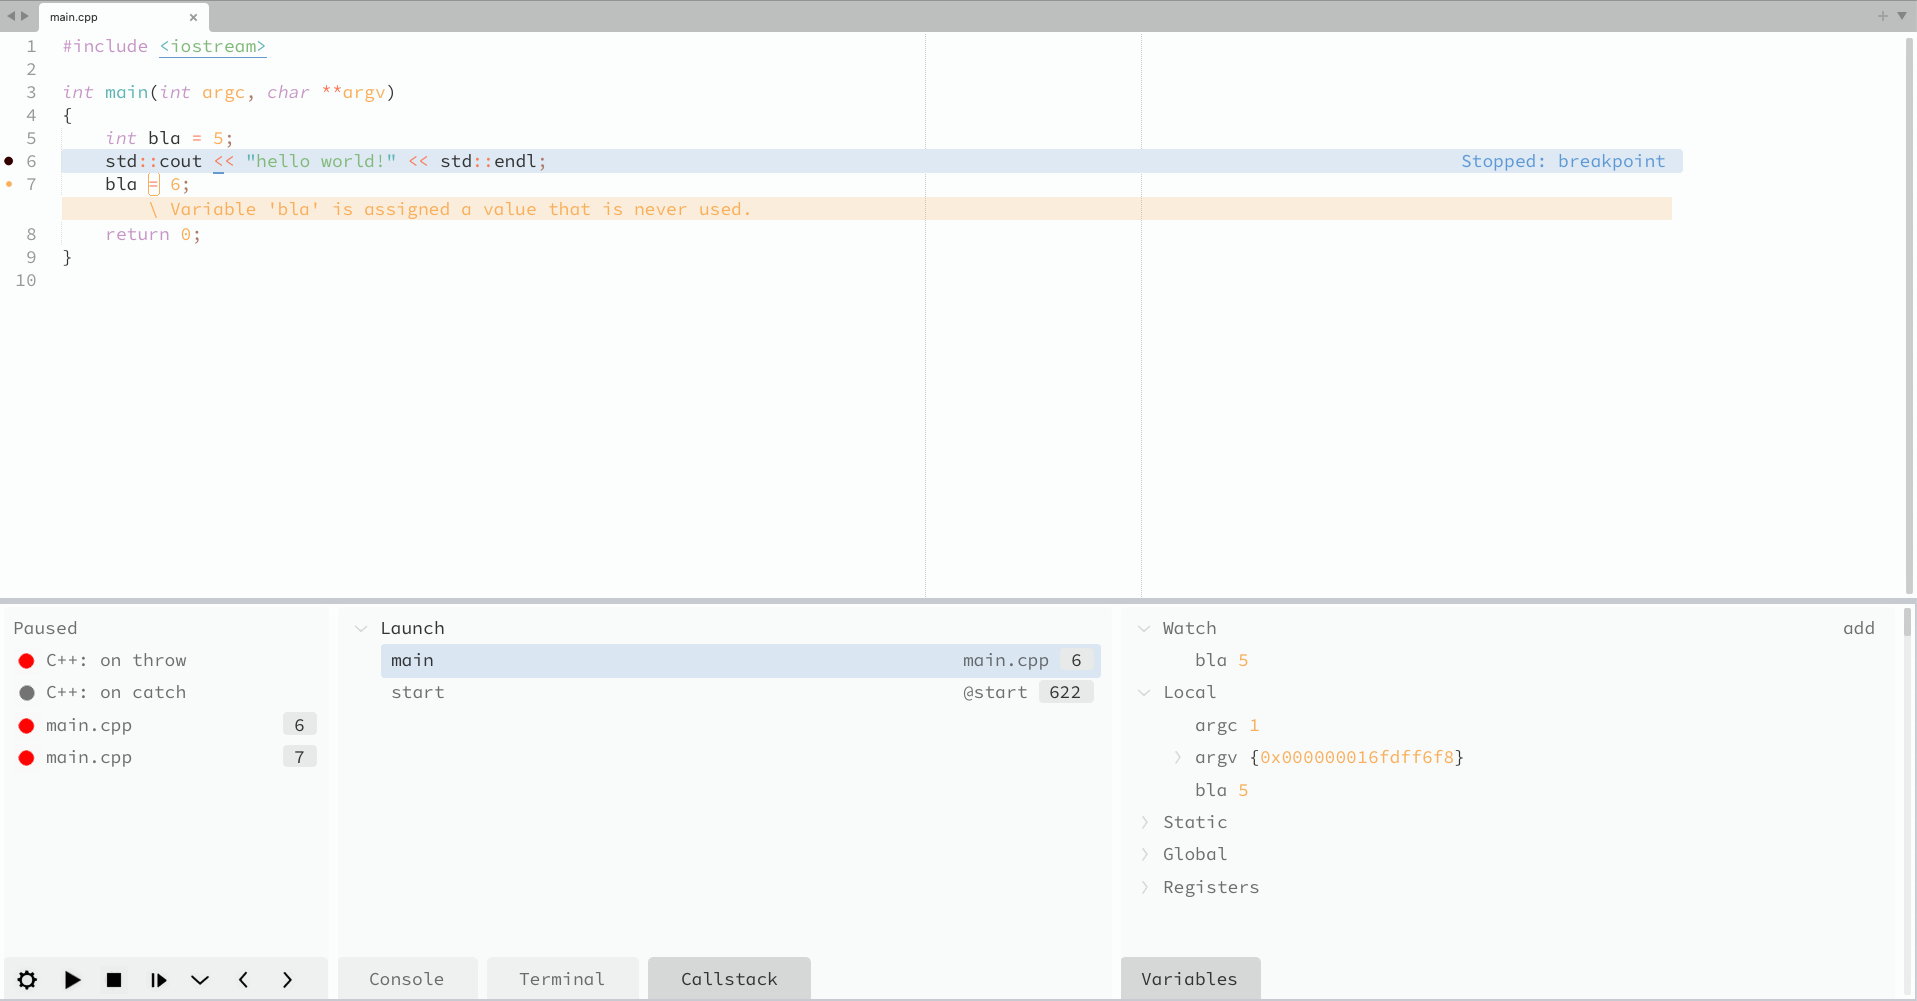
I think their debugger is really solid and good, it displays in a side window step by step of what is actually going on, how variables change the value, and also the step by step highlight, so what step is the next one and so on, I mean you get the picture without my horrendous explanation anyways .
I think implementing something like that would really be useful for Sublime users, don’t know if it will ever be implemented and until it does I will get used to debugging with printf’s I guess. Someone also told me once, that debugging with printf’s is actually very useful and can be better than having an actual debugger, but I guess that is all up for debate
First, als already said, there is no GDB for MacOS ARM64 anyway, so you are using LLDB (LLVMs debugger). I haven’t used it for more than a decade (more like at least 15 years), but the best overall debugger is still Totalview I guess, especially, since Memoryscape - the memory debugger, which had been an extra program back than - is included now.
Well, you are using the same debugger executable (codelldb when using LLDB) with the same configuration in Sublime Text as with VS Code, the interface is only slightly different - about as much as the LSP interface in Sublime Text vs. VS Code (I actually did use the same debuggers in VS Code and Sublime Text). So, if you get LLDB to work in VS Code, the same configuration with little variation in syntax works with Sublime Text and any other editor which supports the Debug Adapter Protocol (DAP).
And as I’ve already said: if you would post your project configuration, I could help you and make it work.
It would really be a good idea if you would stop confusing beginners with information which is misleading at best.
First, the OP is using MacOS on ARM64, there is no working GDB on that architecture at all.
Second, for Linux there are GDB (GCC’s debugger) and LLDB (LLVM’s/clang’s debugger), the Intel debugger (if you happen to use an AMD64 or x86 CPU), Totalview and the Arm Forge Debugger (TFKA DDT) and others I didn’t mention.
Third: the debugger frontend used by the third party (not by Sublime HQ) Debugger package, which uses the Debug Adapter Protocol (DAP) to get a graphical frontend for the many supported debuggers. This DAP is used by VS Code - like LSP - and an interface used by other editors/IDEs to present a single graphical frontend to many different debuggers (for languages like C, C++, Rust, Fortran, Go, Python …).


 .
.