[size=200]Introduce you Web Inspector[/size]
sokolovstas.github.com/SublimeWebInspector
This is a small part of Google Chrome Developer Tools right on your fingertips. It allow you to debug JavaScript directly from Sublime Text 2.
[size=150]Installation:[/size]
Use package manger and install “Web Inspector”
You can set and remove breakpoints right in the editor:

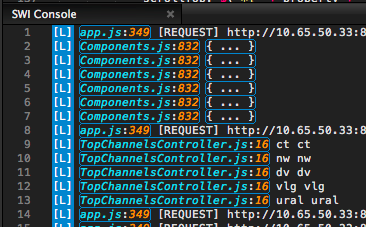
See all console messages with level:

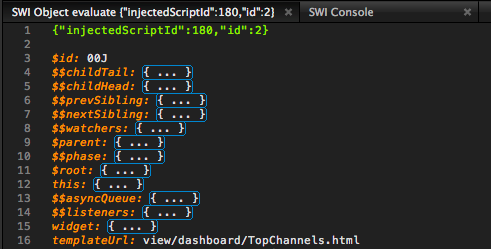
Click on name:line region bring you right to file and line, and if you click on { … } you can see object properties:

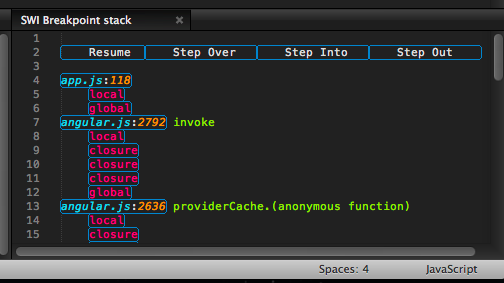
On breakpoints you can see a stack and all variables (local, global, closure):
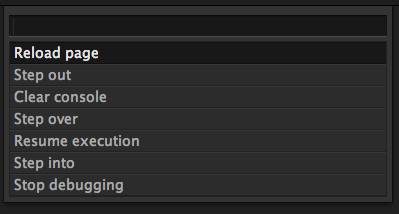
And command palette:

Feel free to feedback here! If you find bug please add issue on github.
[size=150]And BONUS! On file save current debug session will clean cache and reload page. If you save css file only styles will be reloaded.[/size]


