Sublime Forum

Next: Sublime Debug

#1

I’ve been using Sublime Merge now for a while and I’m liking it so far. I’m returning from from VS Code because of the speed and Sublime Merge really fills a gap Sublime Text had.

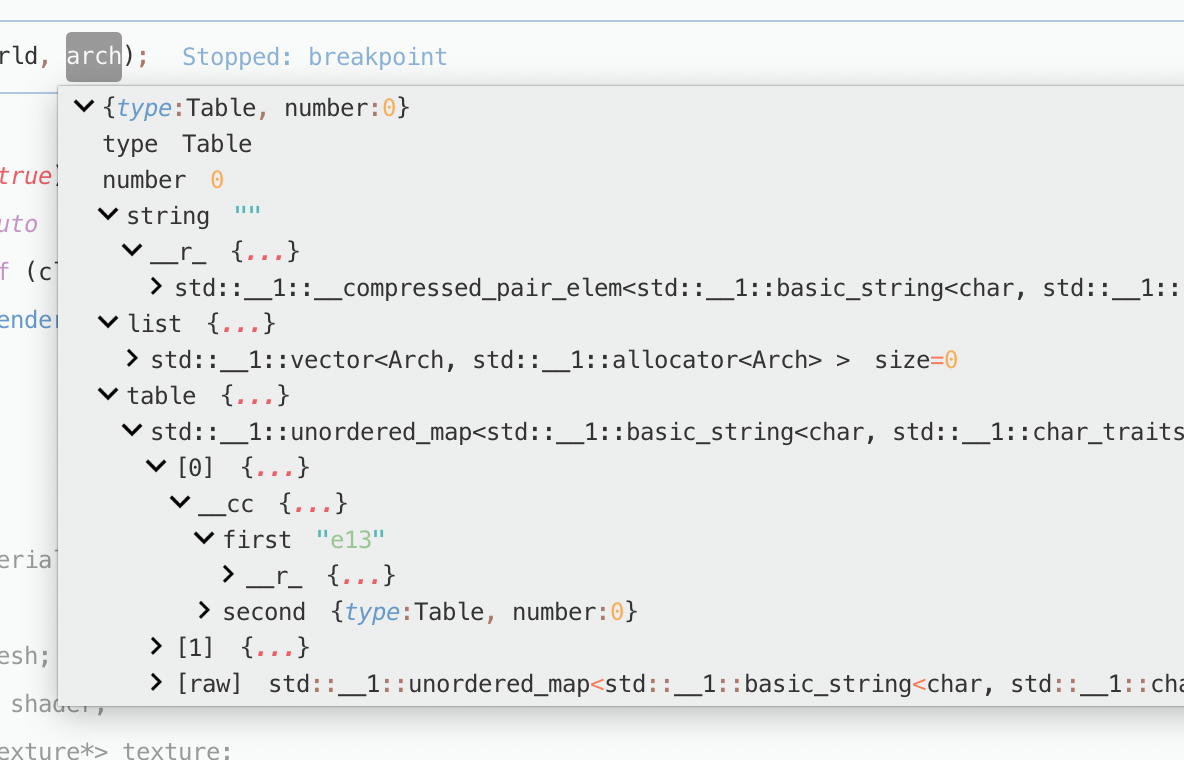
Can we expect also an independent debug client, to completely replace VS Code? Sublime Debug would be awesome :wink:

1 Like

#2

Haven’t used it myself, but this plugin exists:

1 Like

#3

Nice! Just tested it and the functionality is there… The local variables tree needs a little work and the hover pop ups too, but it looks like it is taking shape. Thanks for pointing me there!

0 Likes

#4

What issue are you having with the popups/locals tree? Can you attach a screenshot if you have the time?


That is what it looks like for me but it might look different depending on your font settings.

0 Likes

#5

Sure! This happens in php.

In sublime the array keys are lost, and it is impossible to navigate inside them. Here are two videos, of the same breakpoint:

VS Code: https://www.dropbox.com/s/rxt1zod1i8rcsvm/vscode.mp4?dl=0
Sublime Debugger: https://www.dropbox.com/s/5h2ctzg461peatr/sublime.mp4?dl=0

0 Likes

#6

Awesome thanks. It looks like there are two issues here.

The hover evaluates words and $ is not considered part of a word. I’ll try to get someone out this weekend that allows configuring what is considered a word so the php adapter’s configuration can specify that $ is part of a word.

The other issue is that evaluating a variable in the console doesn’t let you dig deeper into the child hierarchy. Adding the following to my configuration fixes it for me. "xdebugSettings": { "max_children": 50, "max_depth": 5 }
Relevant issue: https://github.com/felixfbecker/vscode-php-debug/issues/155

0 Likes

#7

Should be fixed now that $ is included in the hover evaluation for the php debug adapter. Still need to set “max_depth” to dig deeper in the evaluated variables (for some reason this isn’t needed for the variables returned in the stack trace). I also added a php test/example

1 Like

#8

I would love to see a debug client too but unless it could debug x86_32, x86_64, arm, thumb2, aarch64… all at the assembler level, it would be mostly unusable by me and there is only so much one man can do so ill continue to suffer GDB and the like (the single WORST debugger I ever had the misfortune to have to use).

p.s. the NEC 75x ICE would only display the disassembly of an opcode AFTER you had executed it… and i still consider GDB to be the absolute WORST debugger ever created.

0 Likes